Categorical choropleth
This type of map represents entities according to the value taken by a field whose values are grouped into categories (nominal qualitative variables).
Examples include the region to which a country's communes belong, the political party that won the elections in each city, etc.
This type of representation can also be used to represent data grouped into classes (ordinal qualitative variables), such as income classes, age classes, etc.
Examples
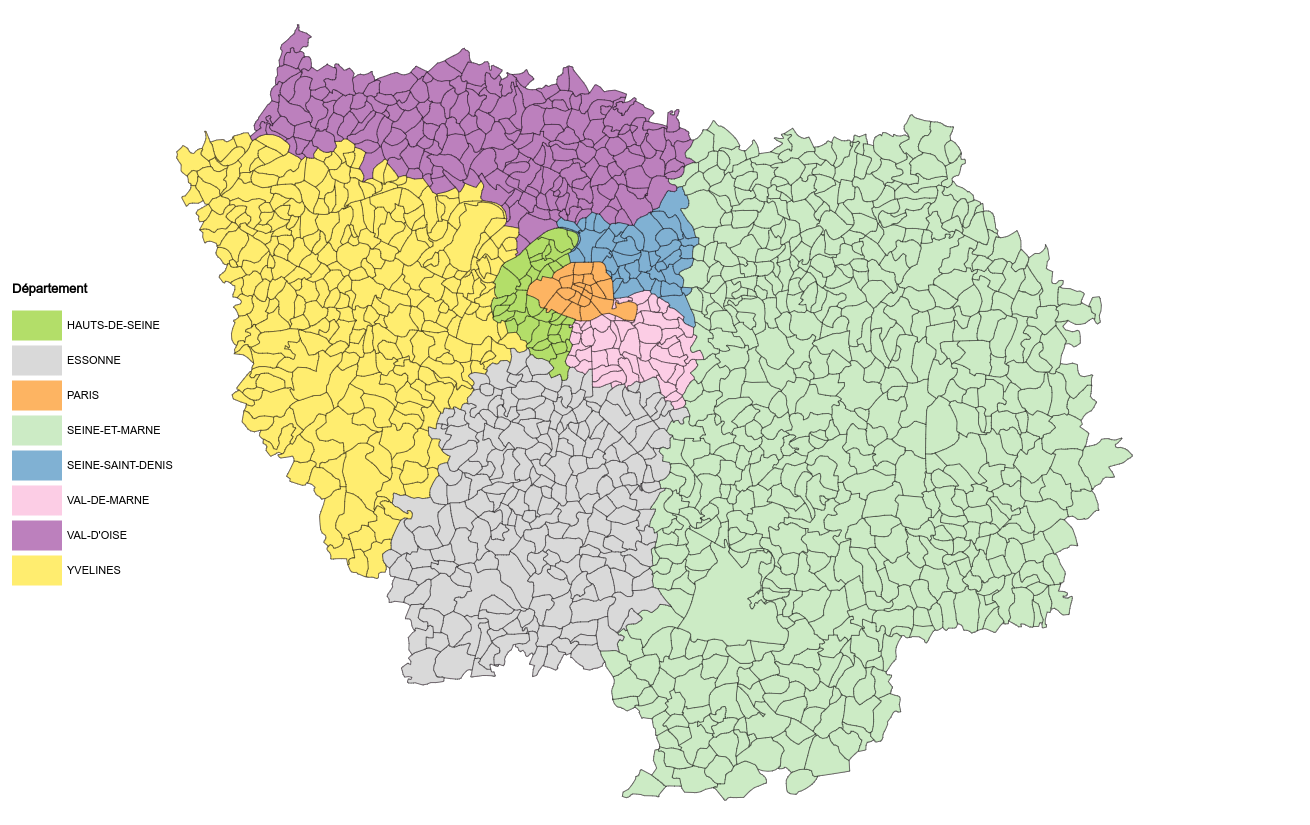
 Categorical choropleth map of the communes of the Île-de-France region, colored according to their department of origin
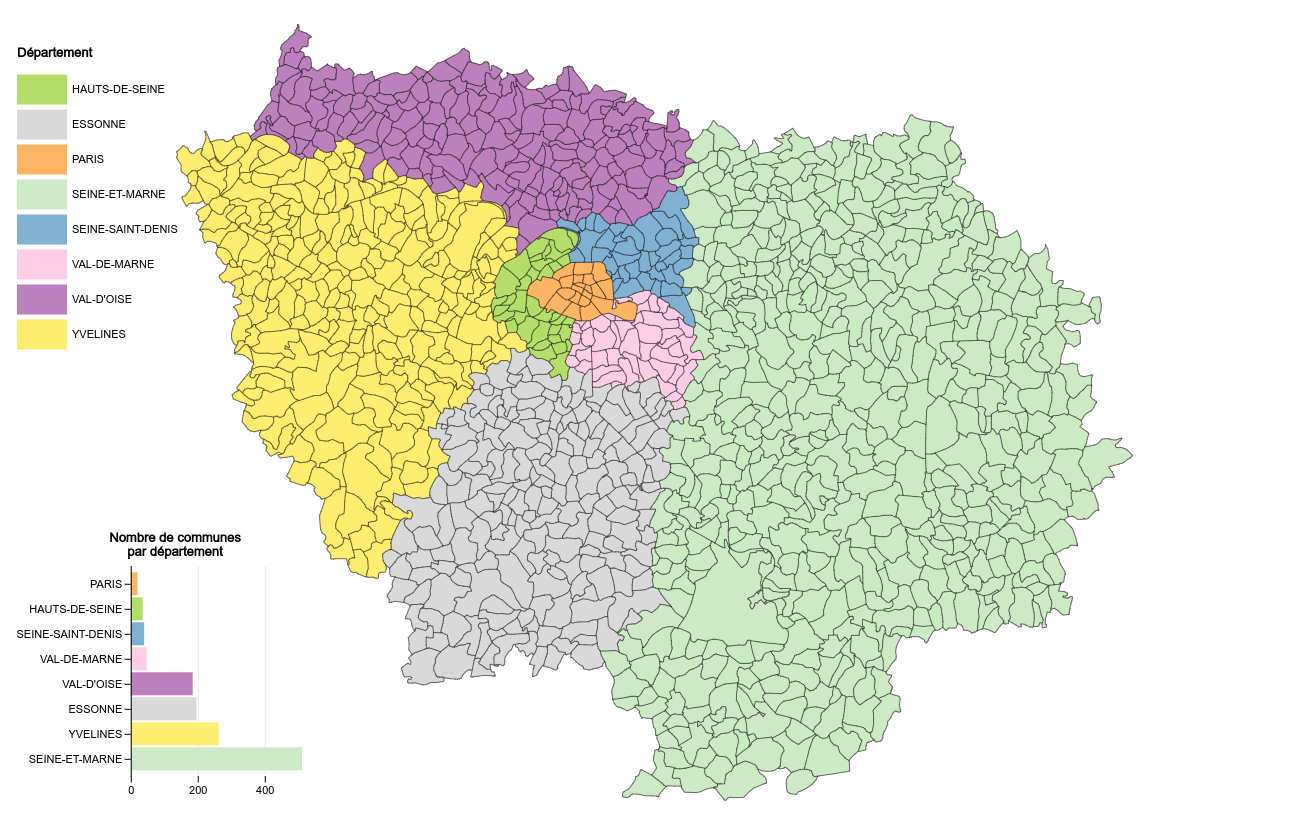
 Categorical choropleth map of the communes of the Île-de-France region, colored according to their department of origin (+ bar chart)