Cartogram
Cartograms, or anamorphoses, are used in statistical cartography to show the importance of a given phenomenon. They allow territorial units (polygons) to be distorted on the basis of a stock attribute (absolute quantitative variable) relative to the surface area of the entities.
Three methods for creating cartograms are available in Magrit:
- the first, based on the Dougenik et al. algorithm (1), enables the creation of "contiguous" cartograms (the topology of the base map is preserved as far as possible),
- the second, based on Olson's algorithm (2), creates "non-contiguous" cartograms (the method does not seek to preserve the topology of the background map),
- the third, based on the Gastner, Seguy and More algorithm (3), creates "contiguous" cartograms (the topology of the background map is preserved as far as possible).
Methods (1) and (3) offer comparable results in terms of visual quality, but method (1) is generally faster.
Example
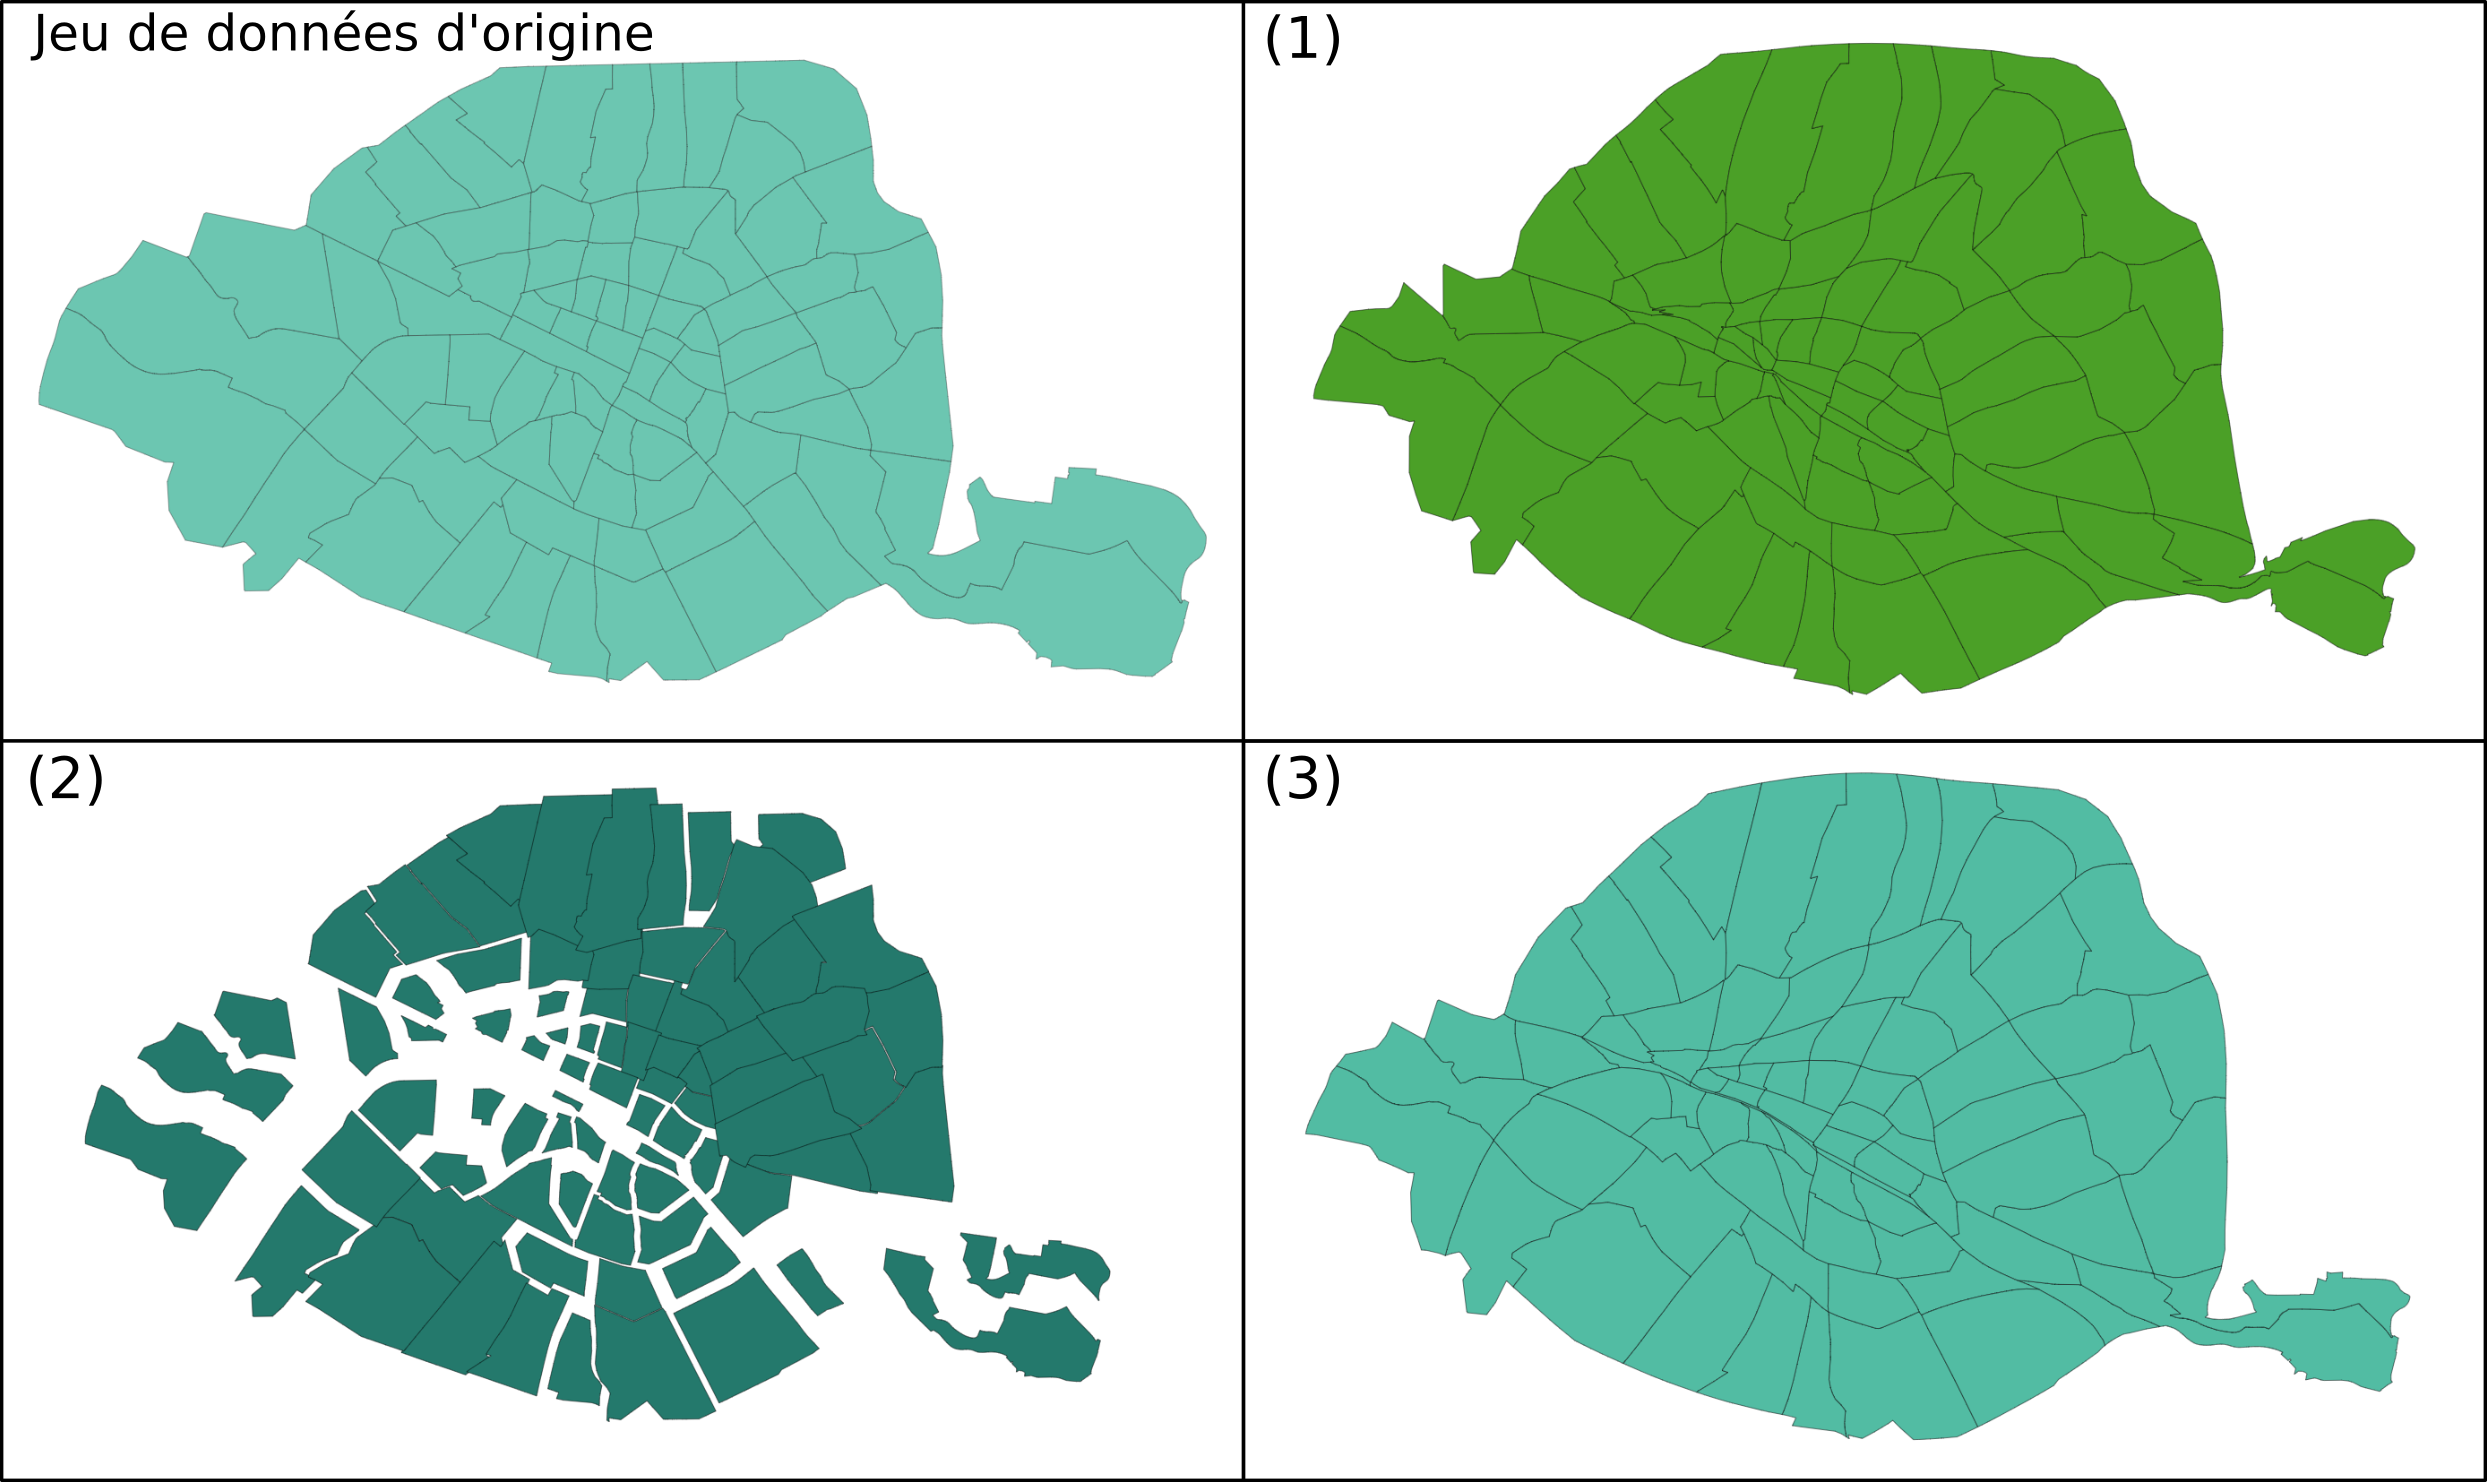 The 3 types of cartograms applied to Paris neighborhoods (variable: Population 2012)
References
(1) Dougenik, James A.; Chrisman, Nicholas R.; Niemeyer, Duane R. (1985), "An Algorithm to Construct Continuous Area Cartograms", The Professional Geographer, 37(1). doi: 10.1111/j.0033-0124.1985.00075.x
(2) Olson, Judy M. (1976). "Noncontiguous Area Cartograms". The Professional Geographer, 28(4). doi: 10.1111/j.0033-0124.1976.00371.x
(3) Gastner, Michael T.; Seguy, Vivien; More, Pratyush (2018). "Fast flow-based algorithm for creating density-equalizing map projections". Proceedings of the National Academy of Sciences USA, 115:E2156-E2164. doi: 10.1073/pnas.1712674115