Pictograms (categorical)
WARNING
The english version of the documentation is currently under construction.
Some parts are not yet translated and some translations may be incomplete or inaccurate.
This type of map represents entities according to the value taken by a field whose values are grouped into categories (nominal qualitative variables), using symbols (images or pictograms) to symbolize the entities.
Parameters
When creating a layer of this type, the following parameters must be entered:
- The variable to be used,
- The pictogram to be used for each variable category,
- The name of the resulting layer.
Once the layer has been created, it is possible to modify the pictogram and the name associated with each category.
Example
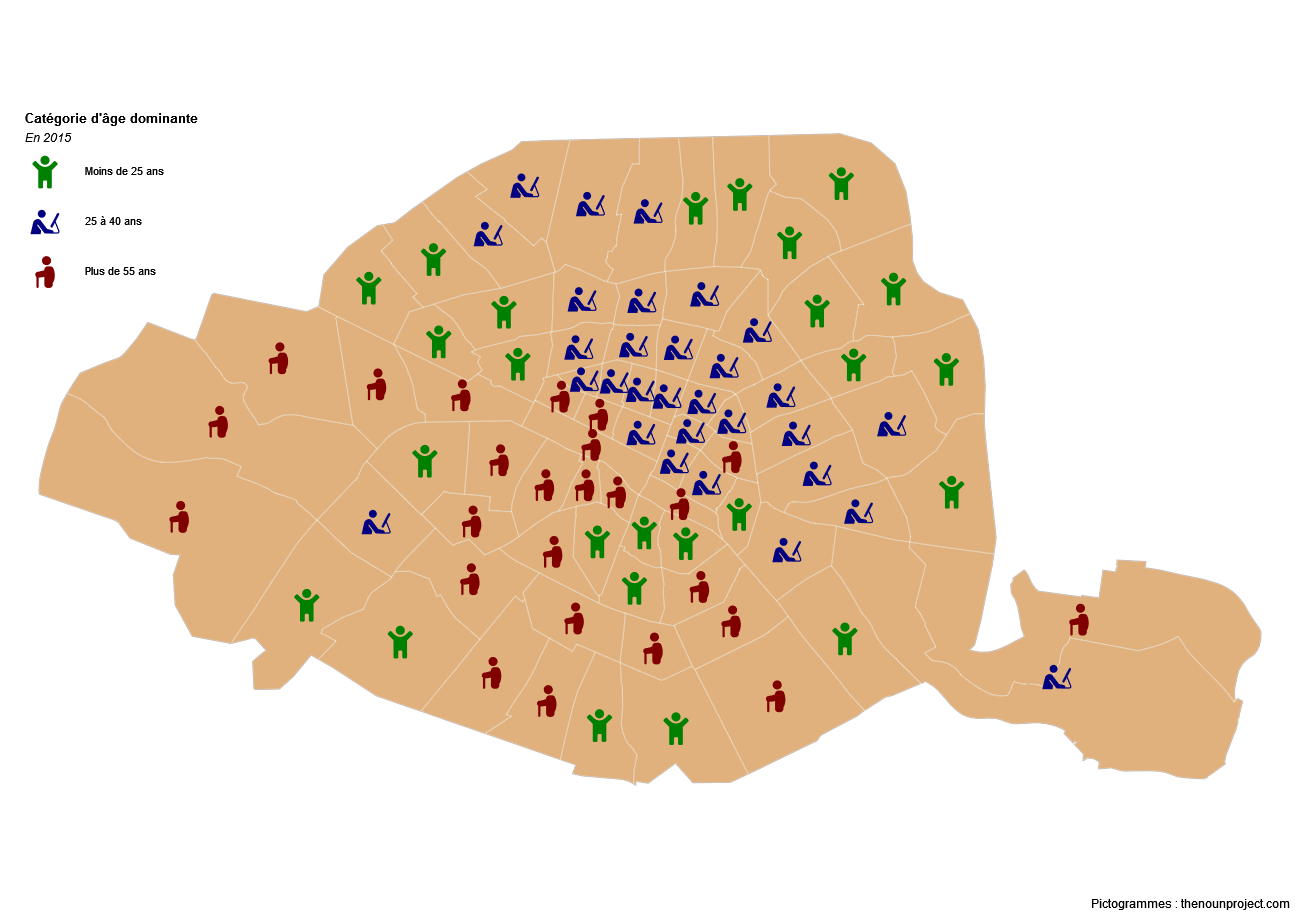 Categorical map in pictograms of the dominant age category by district of Paris