Smoothed map
This is a method for analyzing and representing the spatial distribution of a phenomenon, whatever the heterogeneity of the mesh, at any point on the map, via the representation of the phenomenon's density value and the consideration of its neighborhood.
Depending on the parameters used, these methods make it possible "to see both the local specificities of a phenomenon and its general trends" (Lambert & Zanin, 2016).
The two proposed smoothing methods are:
- Stewart potential,
- Kernel Density Estimation (KDE).
Parameters
When creating a layer of this type, the following parameters must be entered:
- The variable to be used,
- Weight variable / divisor (optional),
- Smoothing type (Stewart or KDE),
- Grid resolution in kilometers,
- The type of kernel among :
- Gaussian or pareto (for Stewart potentials),
- Gaussian, uniform or triangular (for KDEs),
- Smoothing range in kilometers and beta (for Stewart potentials),
- Kernel bandwidth in kilometers (for KDEs).
These parameters are used to calculate the density values of the phenomenon at each point of the calculation grid, taking into account the values of neighboring points. Once these have been calculated, it is necessary to choose threshold values to define the density classes to be represented, in the form of choropleth map.
Here you need to choose :
- Class boundaries,
- The name of the resulting layer.
Example
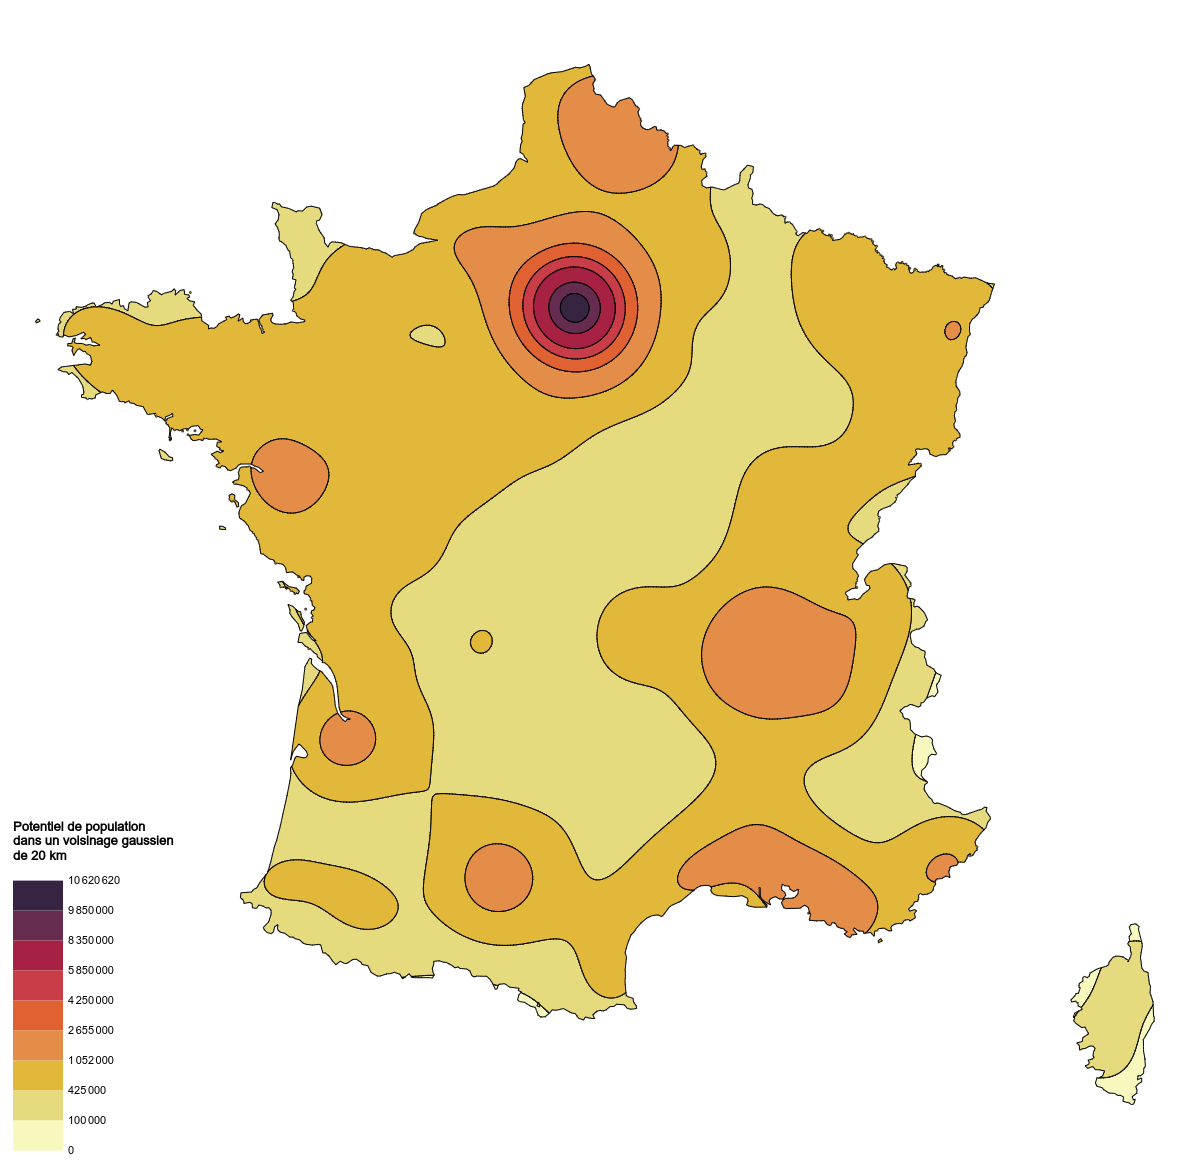 Population potential in a Gaussian neighborhood of 20 km (Stewart method - population data for French communes)