Tutorial - Getting started with Magrit
Example 1: Using Open Data from Grenoble Metropole
We're going to create a simple thematic map with Magrit using your own data.
This will enable us to discover the application's basic functions (importing data, making a join, displaying the data table, choosing a representation, dressing the map and exporting the map).
To do this, we're going to create a map of abstention in the second round of the 2022 legislative election, in Grenoble and by polling station.
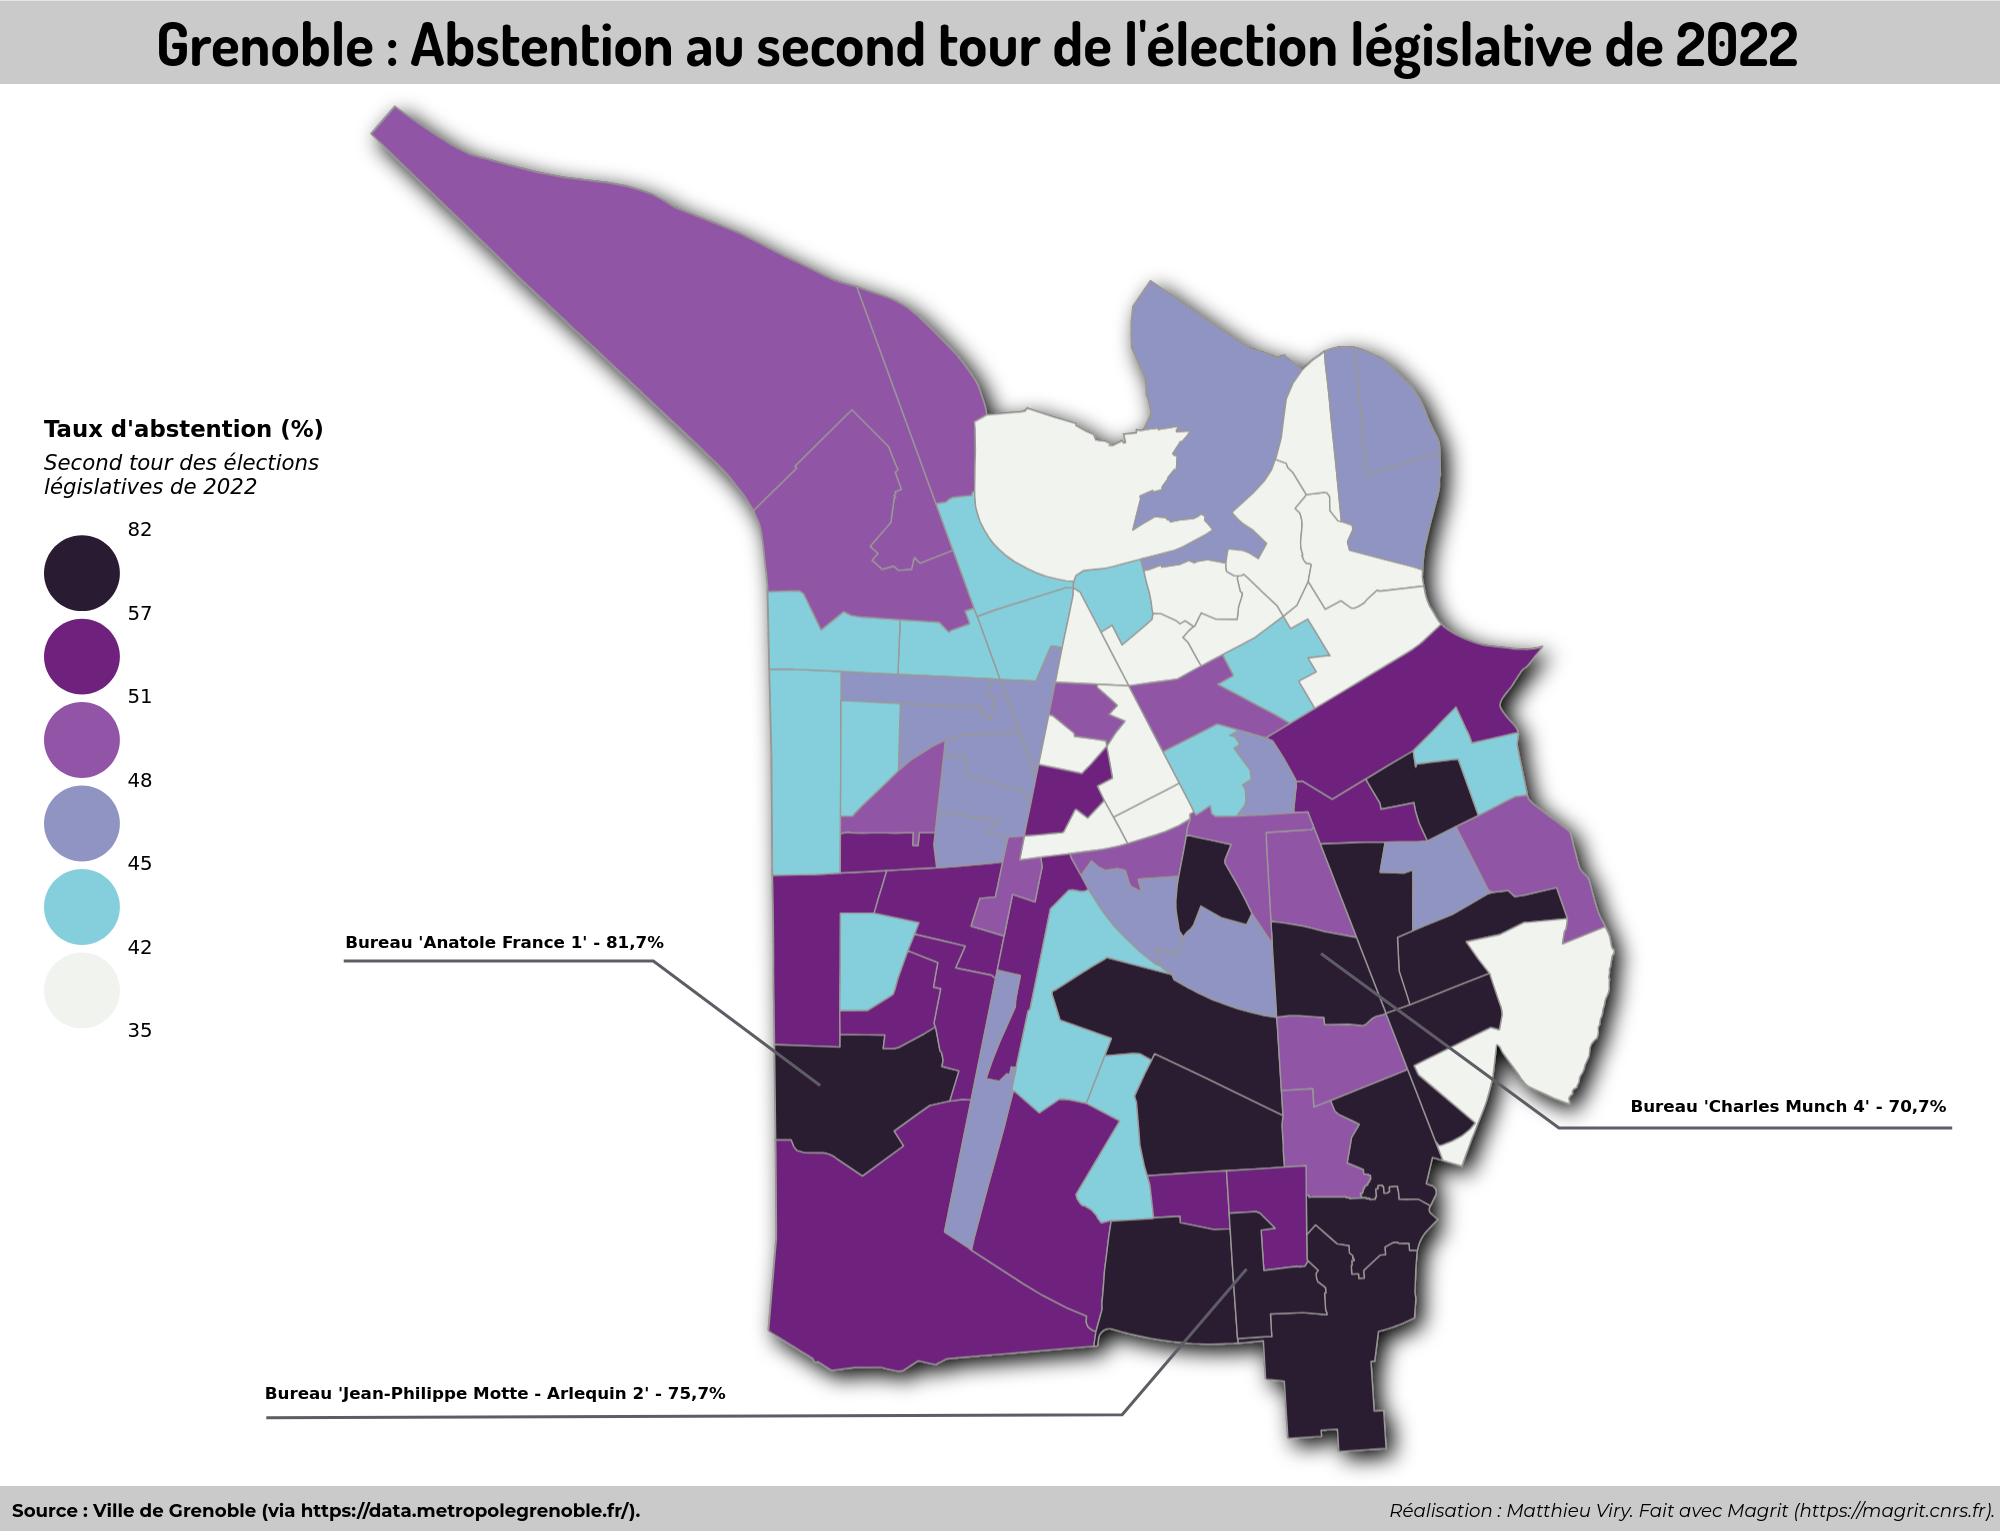 Map 'Grenoble - Abstention au second tour des élections législatives de 2022'
1. Downloading the data
1.1 Recovering the base map
The Grenoble Metropole's Open Data platform makes numerous datasets available, including the delimitation of polling stations in the City of Grenoble: https://data.metropolegrenoble.fr/visualisation/information/?id=les-bureaux-de-vote.
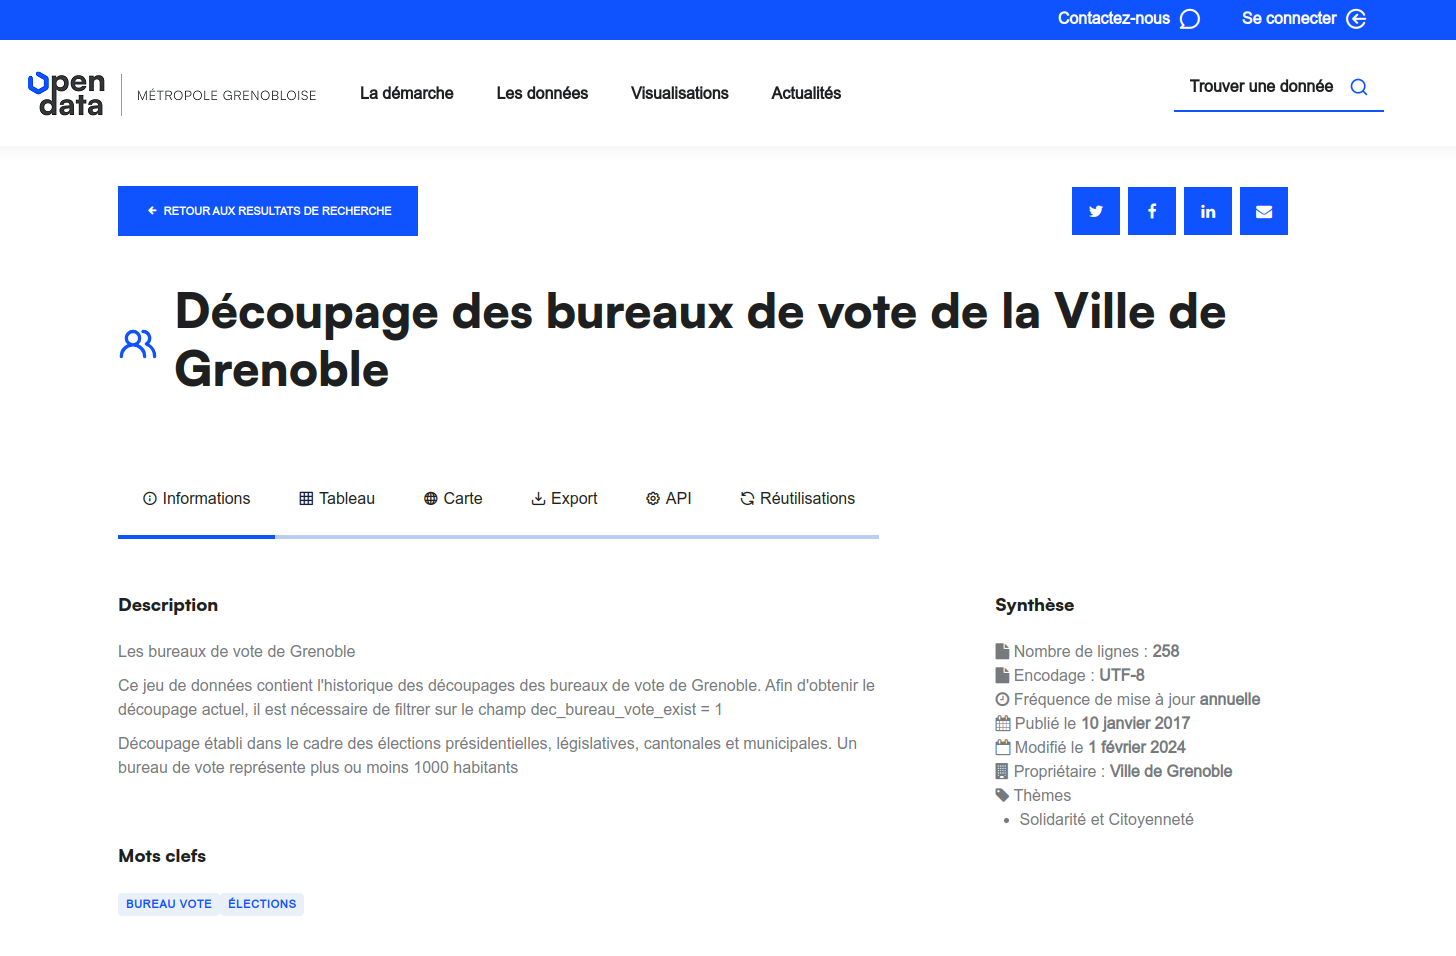 'Grenoble polling station boundaries' page
Several export formats (in the form of geographic files) are available (GeoJSON, Shapefile, KML) and are all compatible with Magrit. We'll use the GeoJSON file for this example.
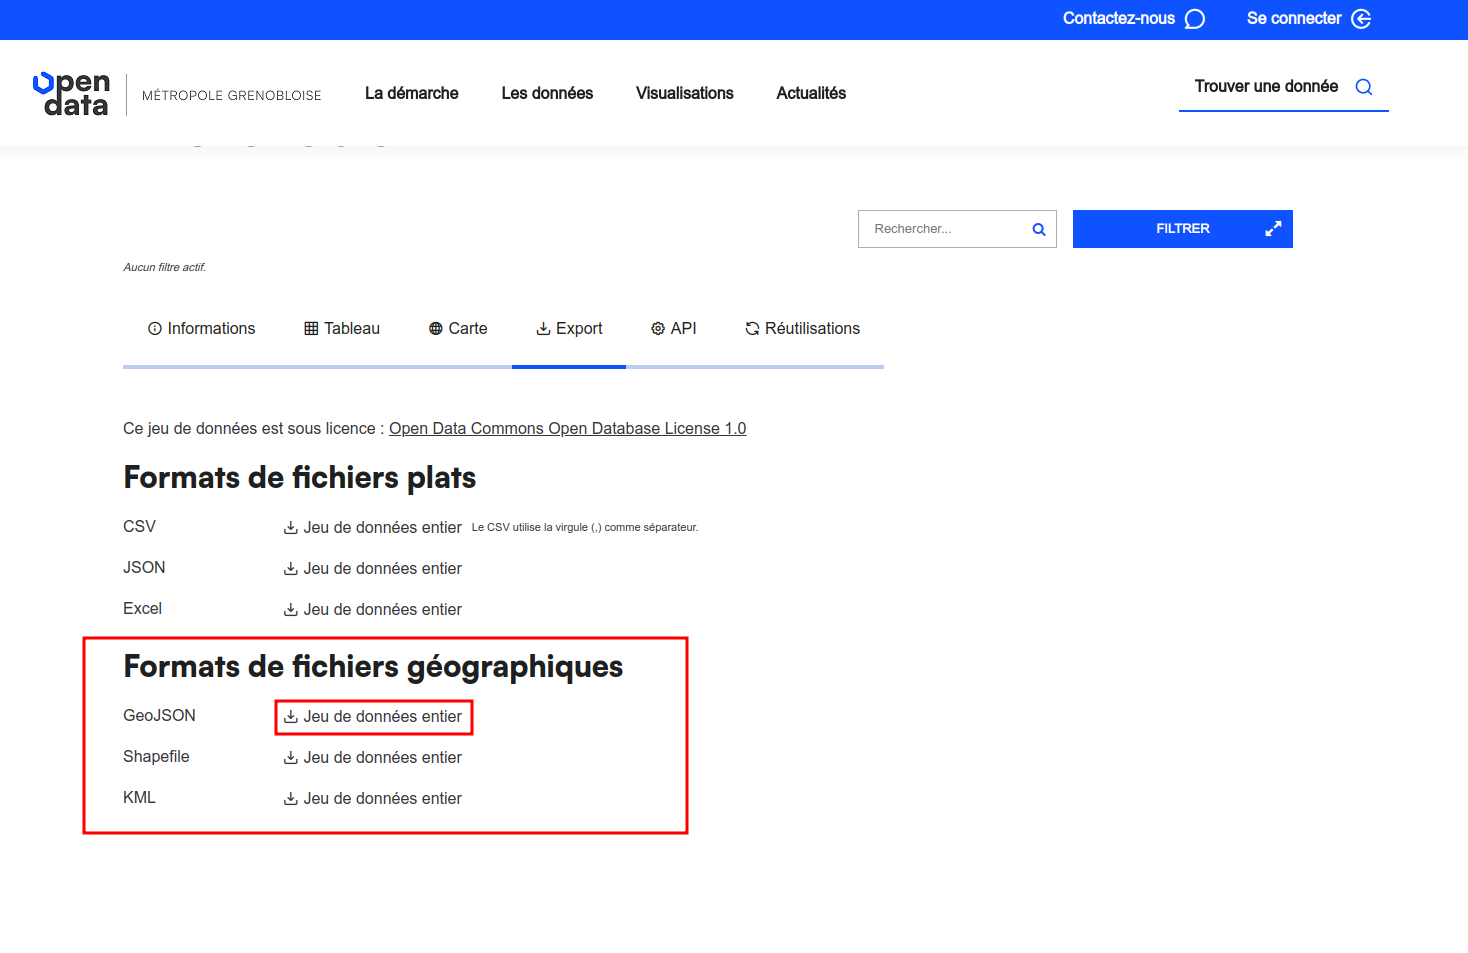 Download GeoJSON file of Grenoble polling stations
1.2 Retrieving the results of the 2022 legislative elections
The results of the 2022 legislative elections are also available on the Grenoble Metropole's Open Data platform: https://data.metropolegrenoble.fr/visualisation/information/?id=resultats_des_elections_legislatives_de_la_ville_de_grenoble.
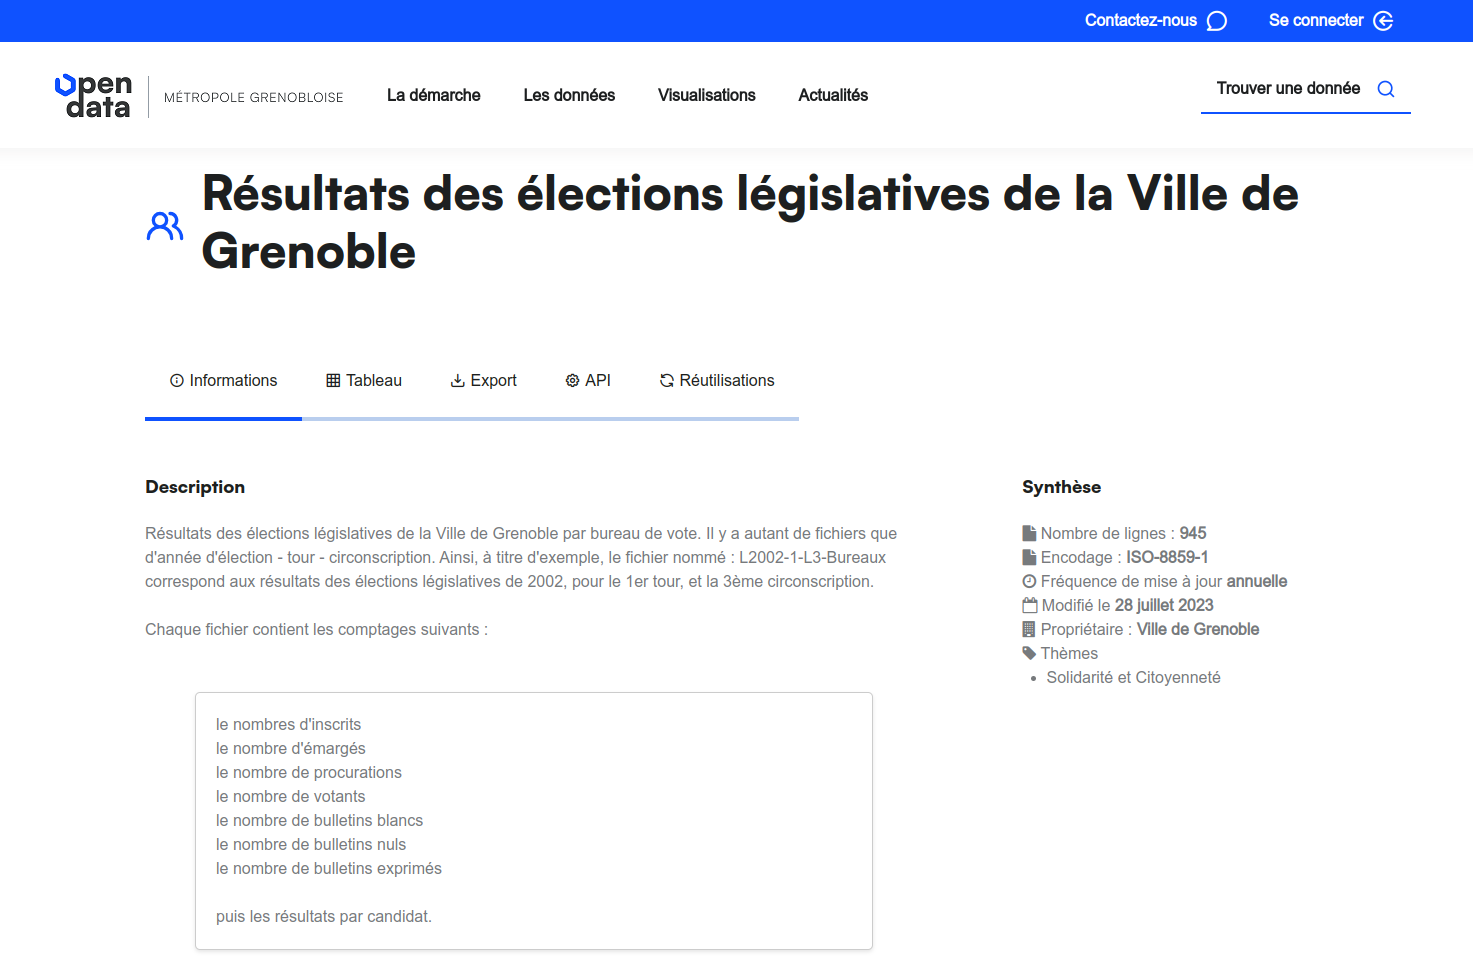 Grenoble legislative elections results page
In the "Export" tab, we'll select the table named "elections_lgislatives_2022_tour_2.csv" and download it in CSV format.
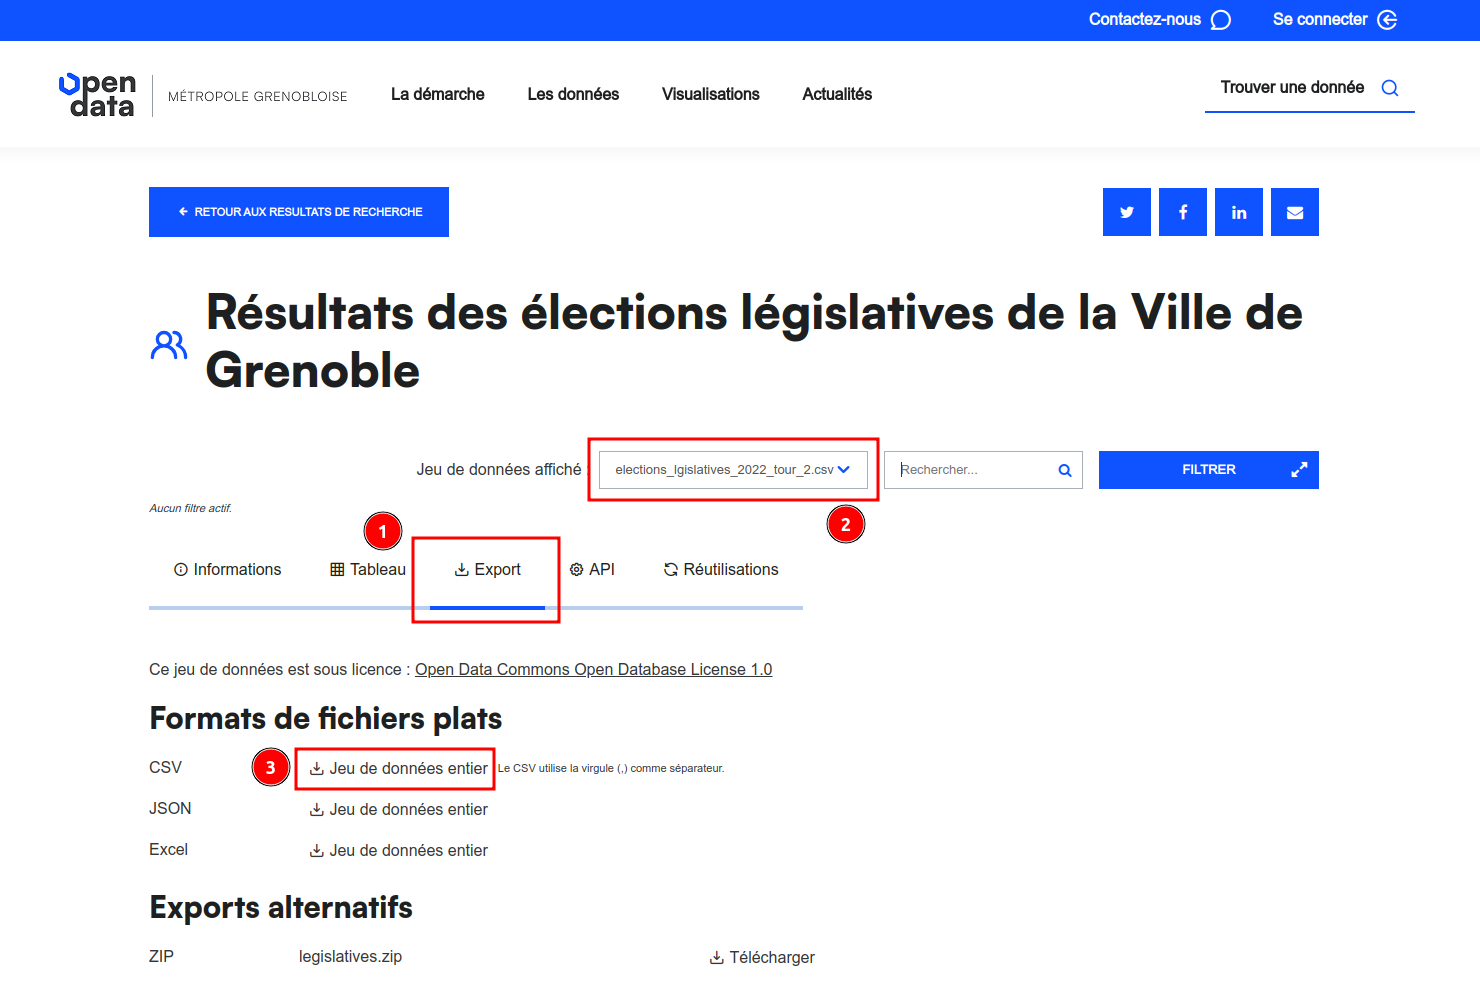 Download CSV file of Grenoble legislative election results
2. Importing the data into Magrit
There are several ways to import data into Magrit (drag & drop or open the import menu and select files).
Here we'll open the data import window (accessible from the left-hand side menu), then select the two files downloaded earlier:
- the polling station GeoJSON file (
decoupage_bureau_vote_epsg4326.geojson), - the CSV file of legislative election results (
elections_lgislatives_2022_tour_2.csv).
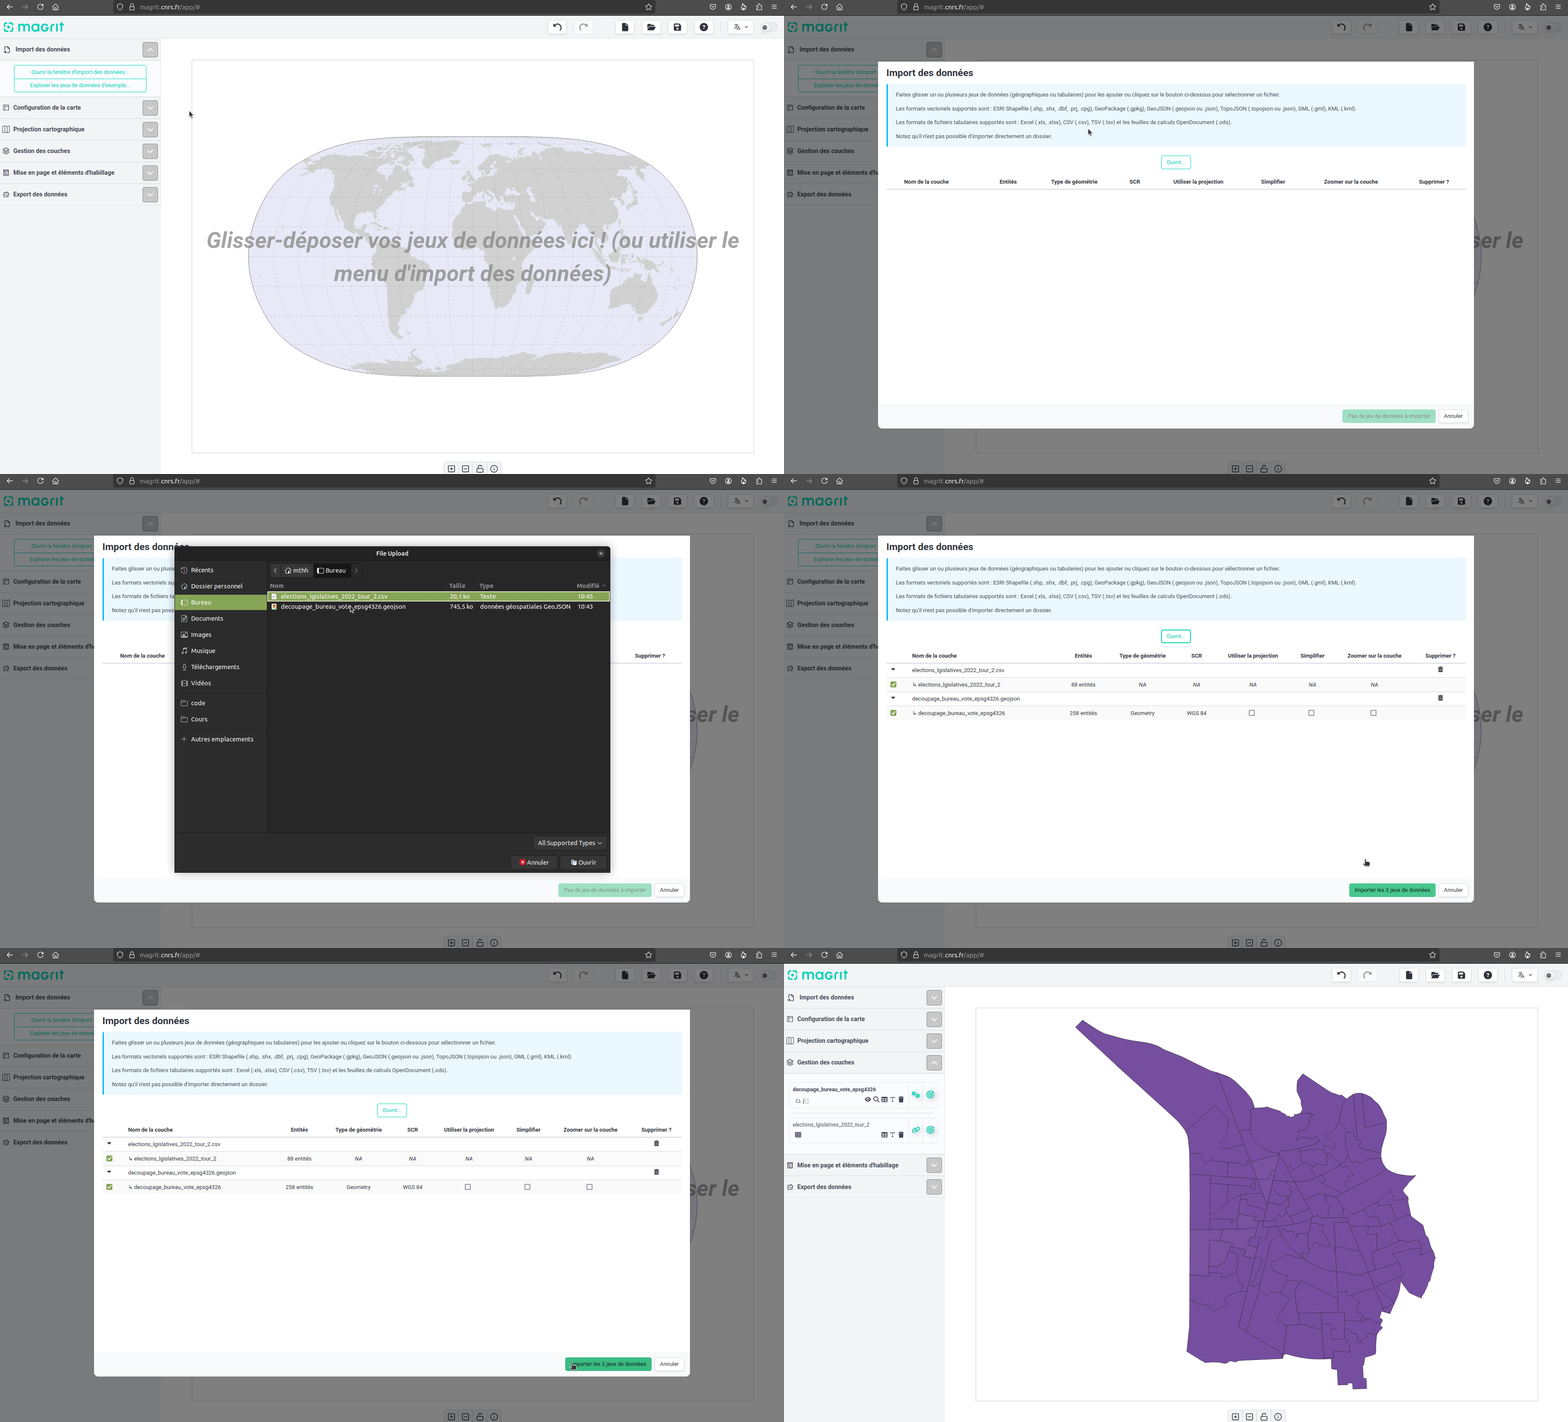 Importing the data into Magrit
After clicking on "Import the 2 datasets", you can see them appear in Magrit's layer manager. The map is also automatically centered on the imported base map.
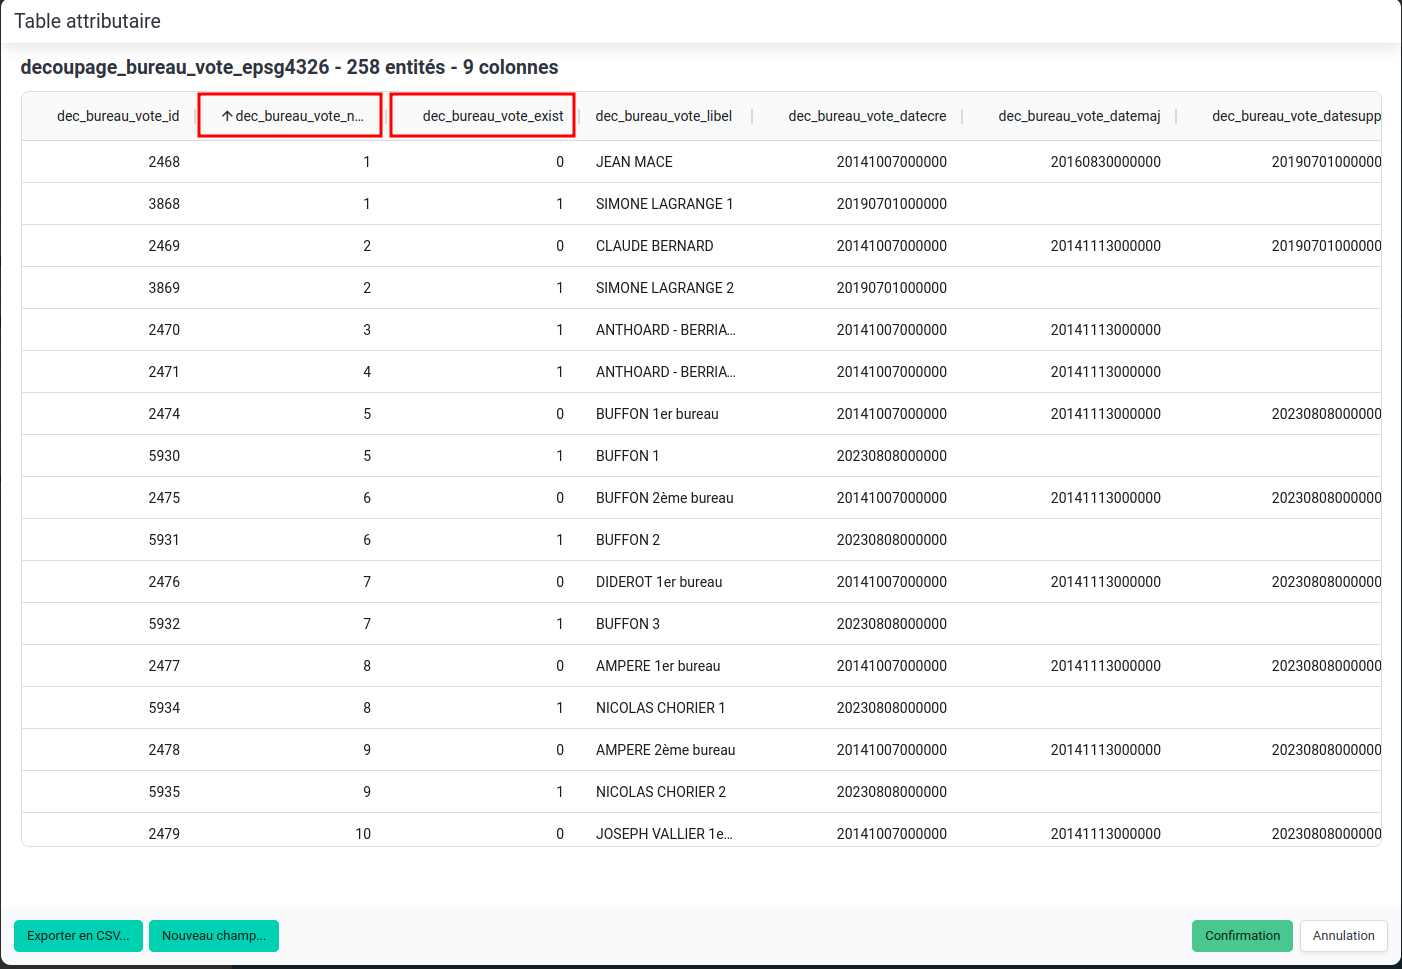 Polling station attribute table
We identify the following columns in the attribute table of the polling station base map:
dec_bureau_vote_num: the polling station code,dec_bureau_vote_exist: the existence of the polling station at the date of the last elections (1 if the polling station exists, 0 otherwise),
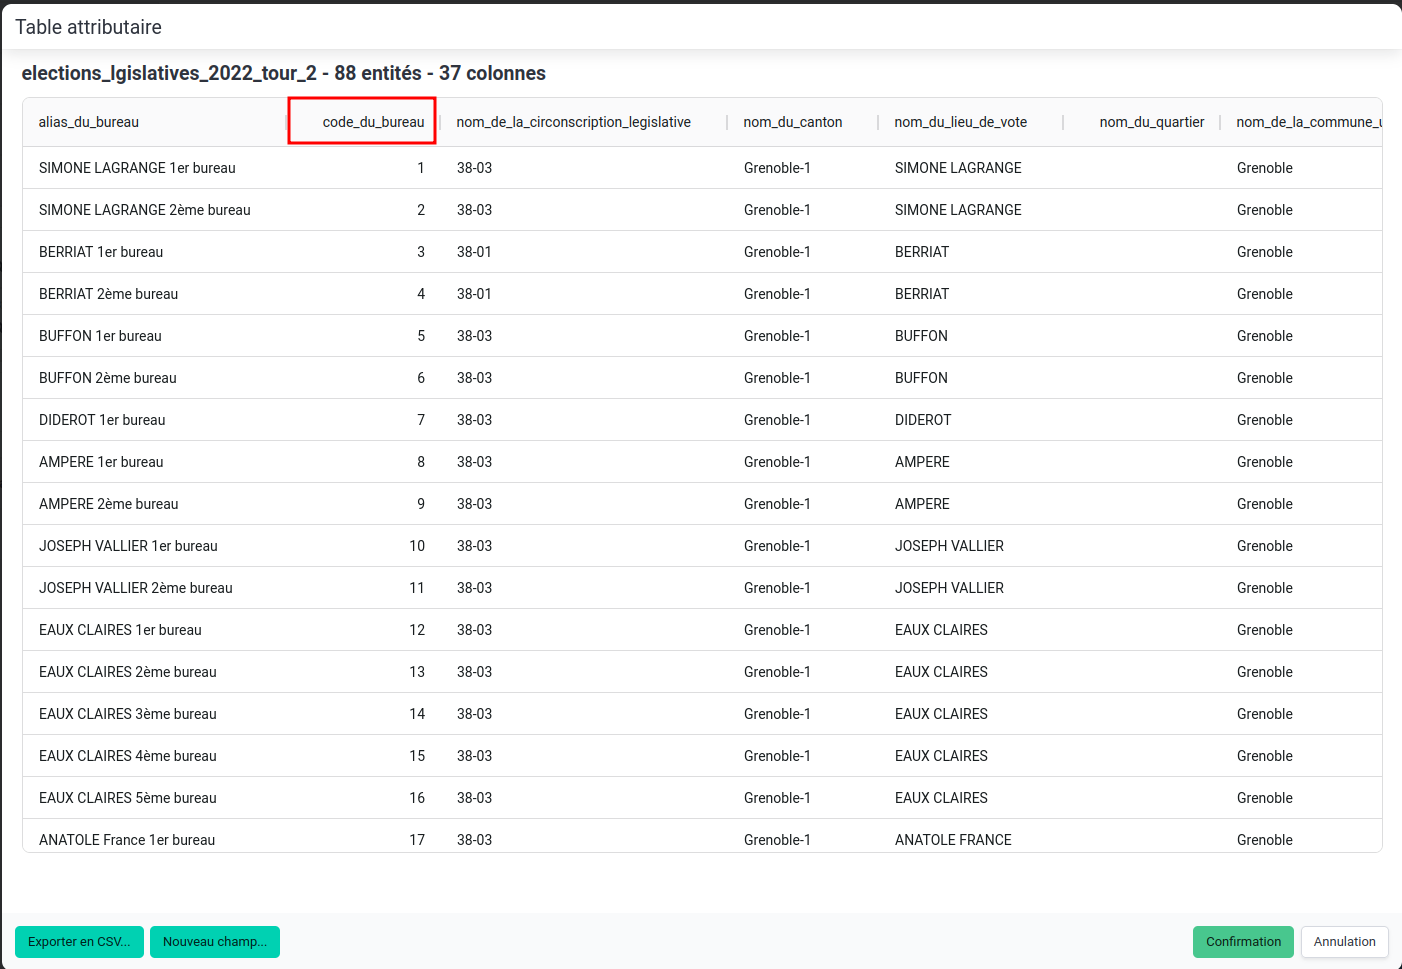 Attribute table for legislative election results
We identify the following columns in the legislative elections results table:
polling_office_code: the code of the polling station,abstention_percentage: the abstention percentage for the second round of the 2022 legislative election.
3. Data preparation
3.1 Selection of current polling stations
The polling station base map contains polling stations that no longer exist at the time of the last elections (this is a dataset containing historical polling station boundaries).
In order to select only current polling stations, we will perform an attribute selection on the polling station layer.
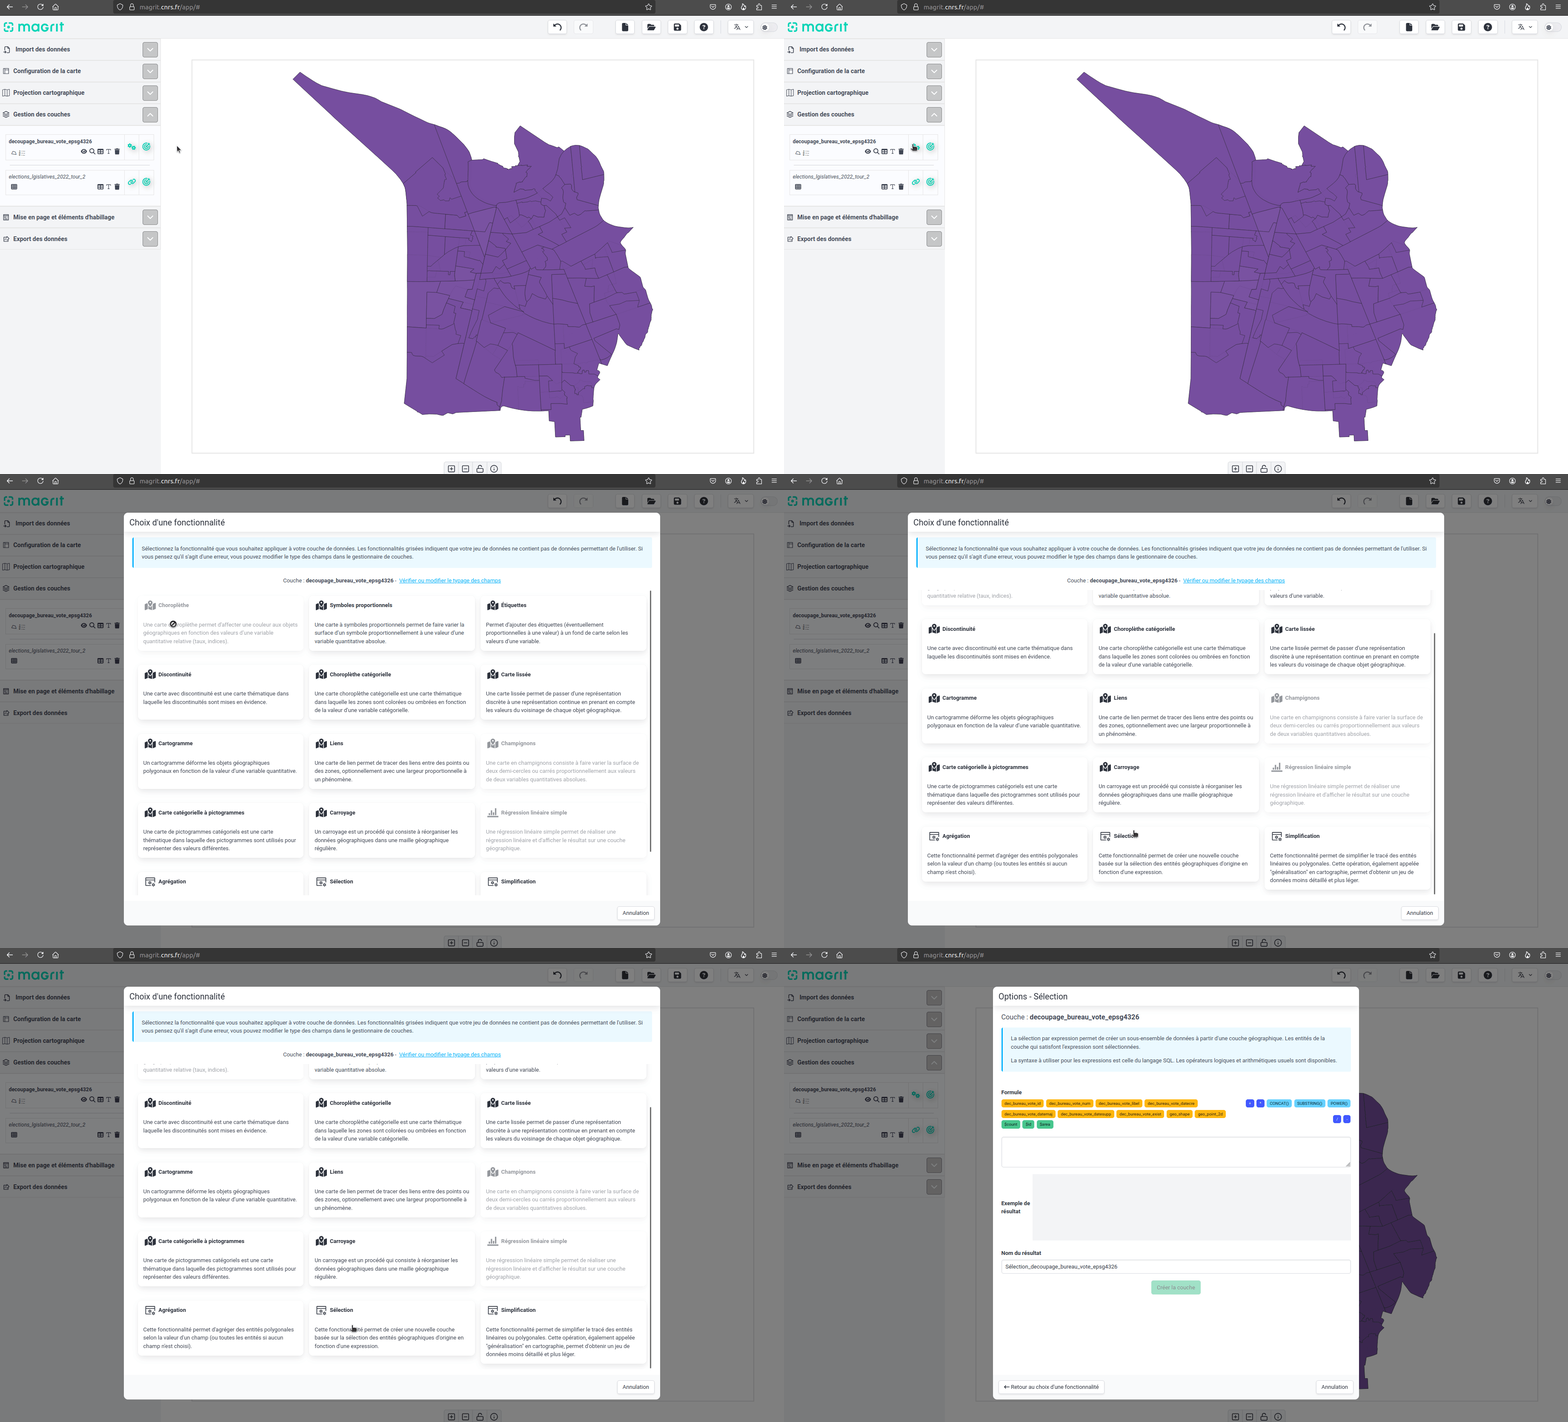 Opening the attribute selection function
This feature performs attribute selection using an SQL-like expression. Entities that satisfy the expression are selected for the creation of a new layer. In this window, it is also necessary to enter a name for the new layer.
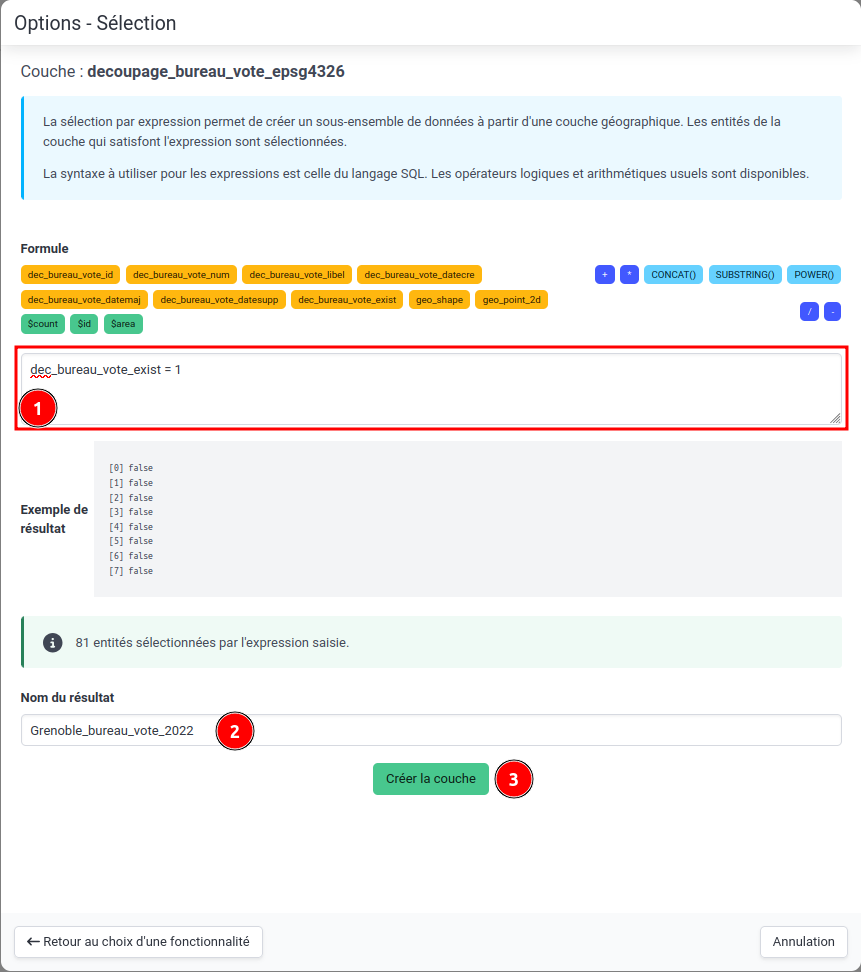 Selection of current polling stations
Once the layer has been created, it appears in Magrit's layer manager and on the map, above the other layers. It is now possible to deactivate the historical polling stations layer.
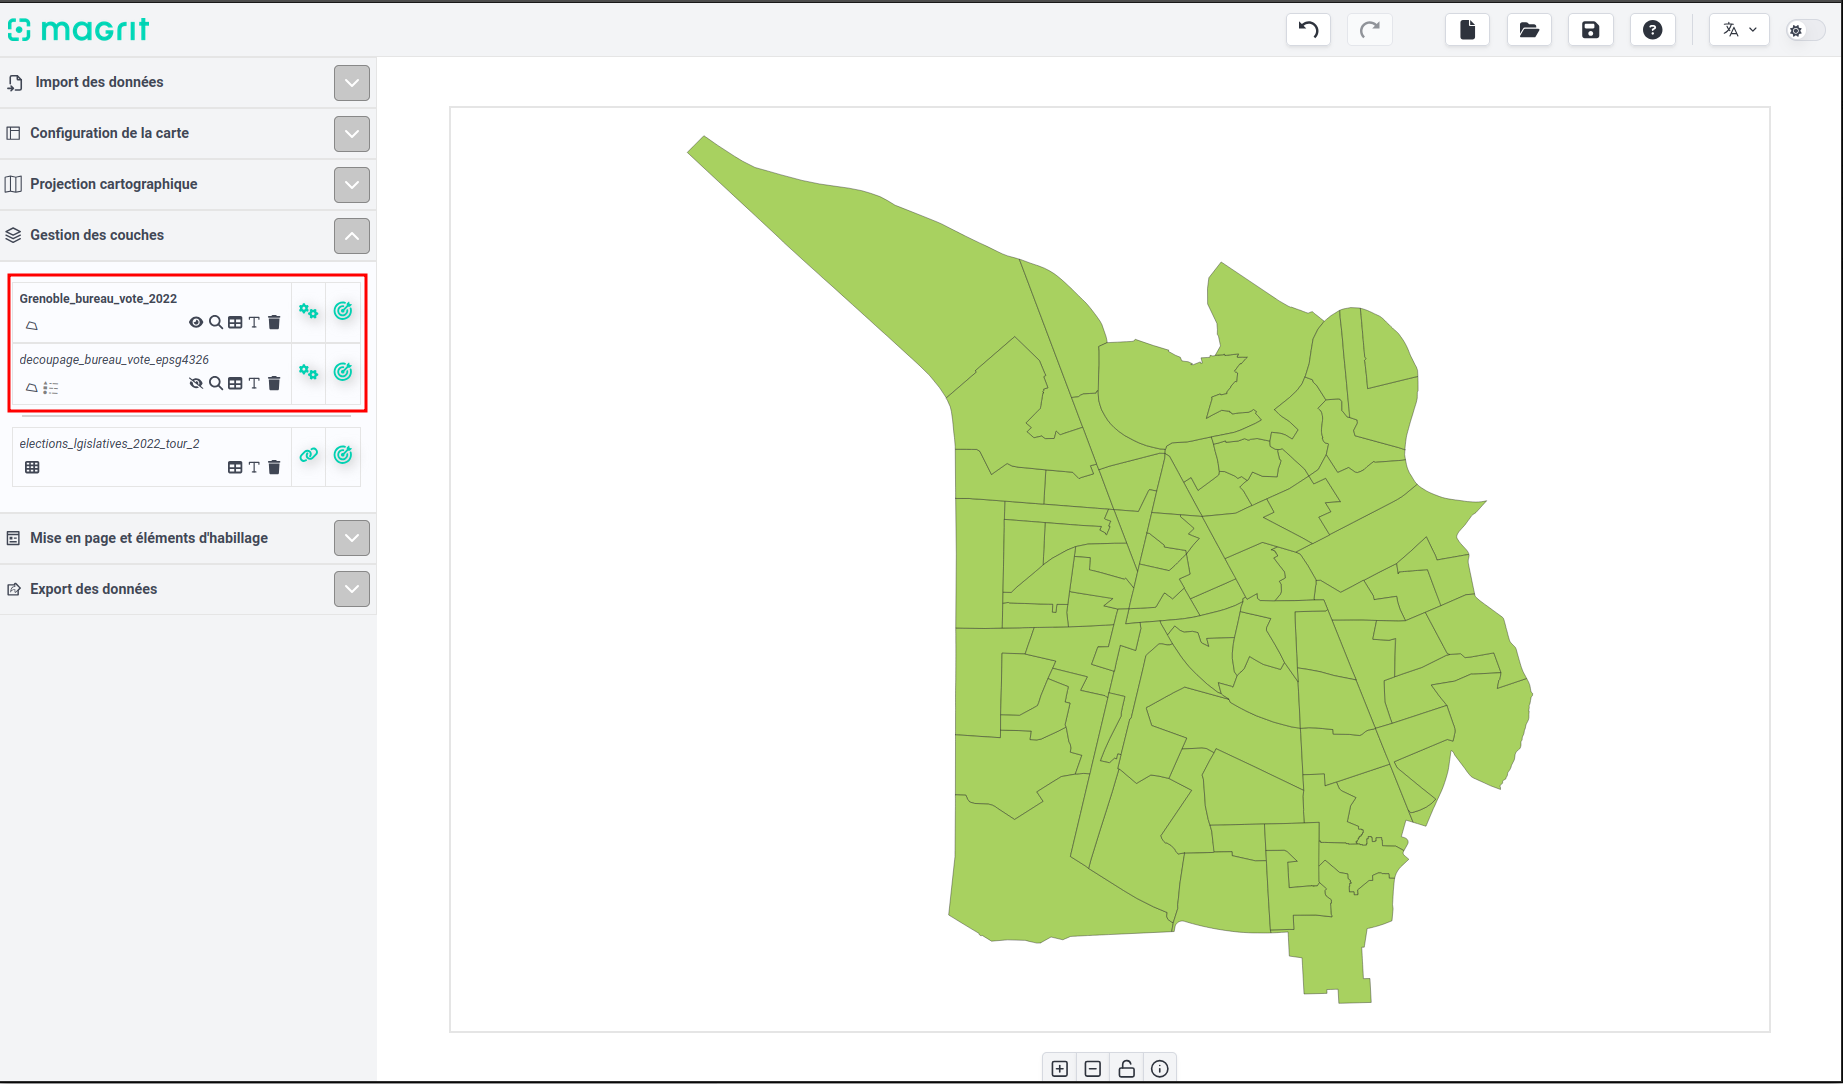 View of the interface after creation of the new layer and deactivation of the historical layer
3.2 Joining the two datasets
We're now going to perform a join between the current polling station layer and the legislative elections results table, based on the common field (i.e. present in both tables to be joined) containing the polling station code.
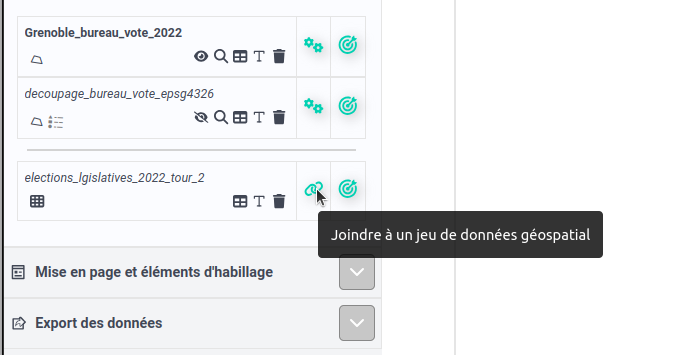 Access to join functionality
In the window that opens, you need to make several choices:
- which background map to join the table to (here, the current polling station layer, created earlier and named
Grenoble_bureau_vote_2022), - which table field to join to which background map field (here,
office_codefrom the legislative elections results table withdec_office_vote_numfrom the current polling station layer).
Once these choices have been made, it's possible to see whether matches have been found between the two datasets. Here, we can see that all the polling stations in the base map have found a match in the table of legislative election results. You can then validate the join by clicking on "Confirm".
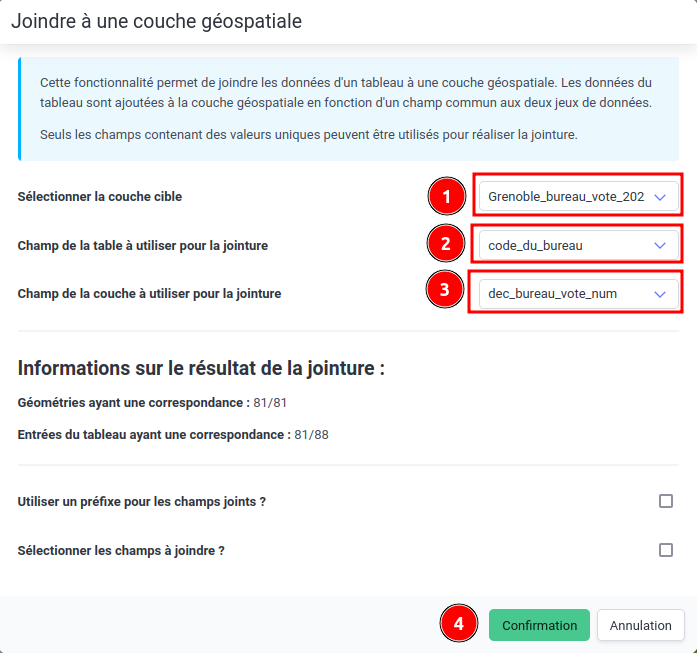 Selecting fields for the join
The attached data are added directly to the attribute table of the base map (i.e. the base map now contains new columns).
4. Map creation
4.1 Choosing a cartographic projection
Projection is an important element in cartography, as it allows the earth's surface to be represented on a plane.Several projections are available in Magrit, and we can choose the one best suited to the geographical area you wish to represent.
By default, Magrit uses the "Natural Earth 2" map projection, which represents the entire globe.
Since the data we're using concerns the city of Grenoble, we're going to choose a projection more suited to this geographical area: the official cartographic projection of Metropolitan France: "RGF93 v1 / Lambert-93 (EPSG:2154)".
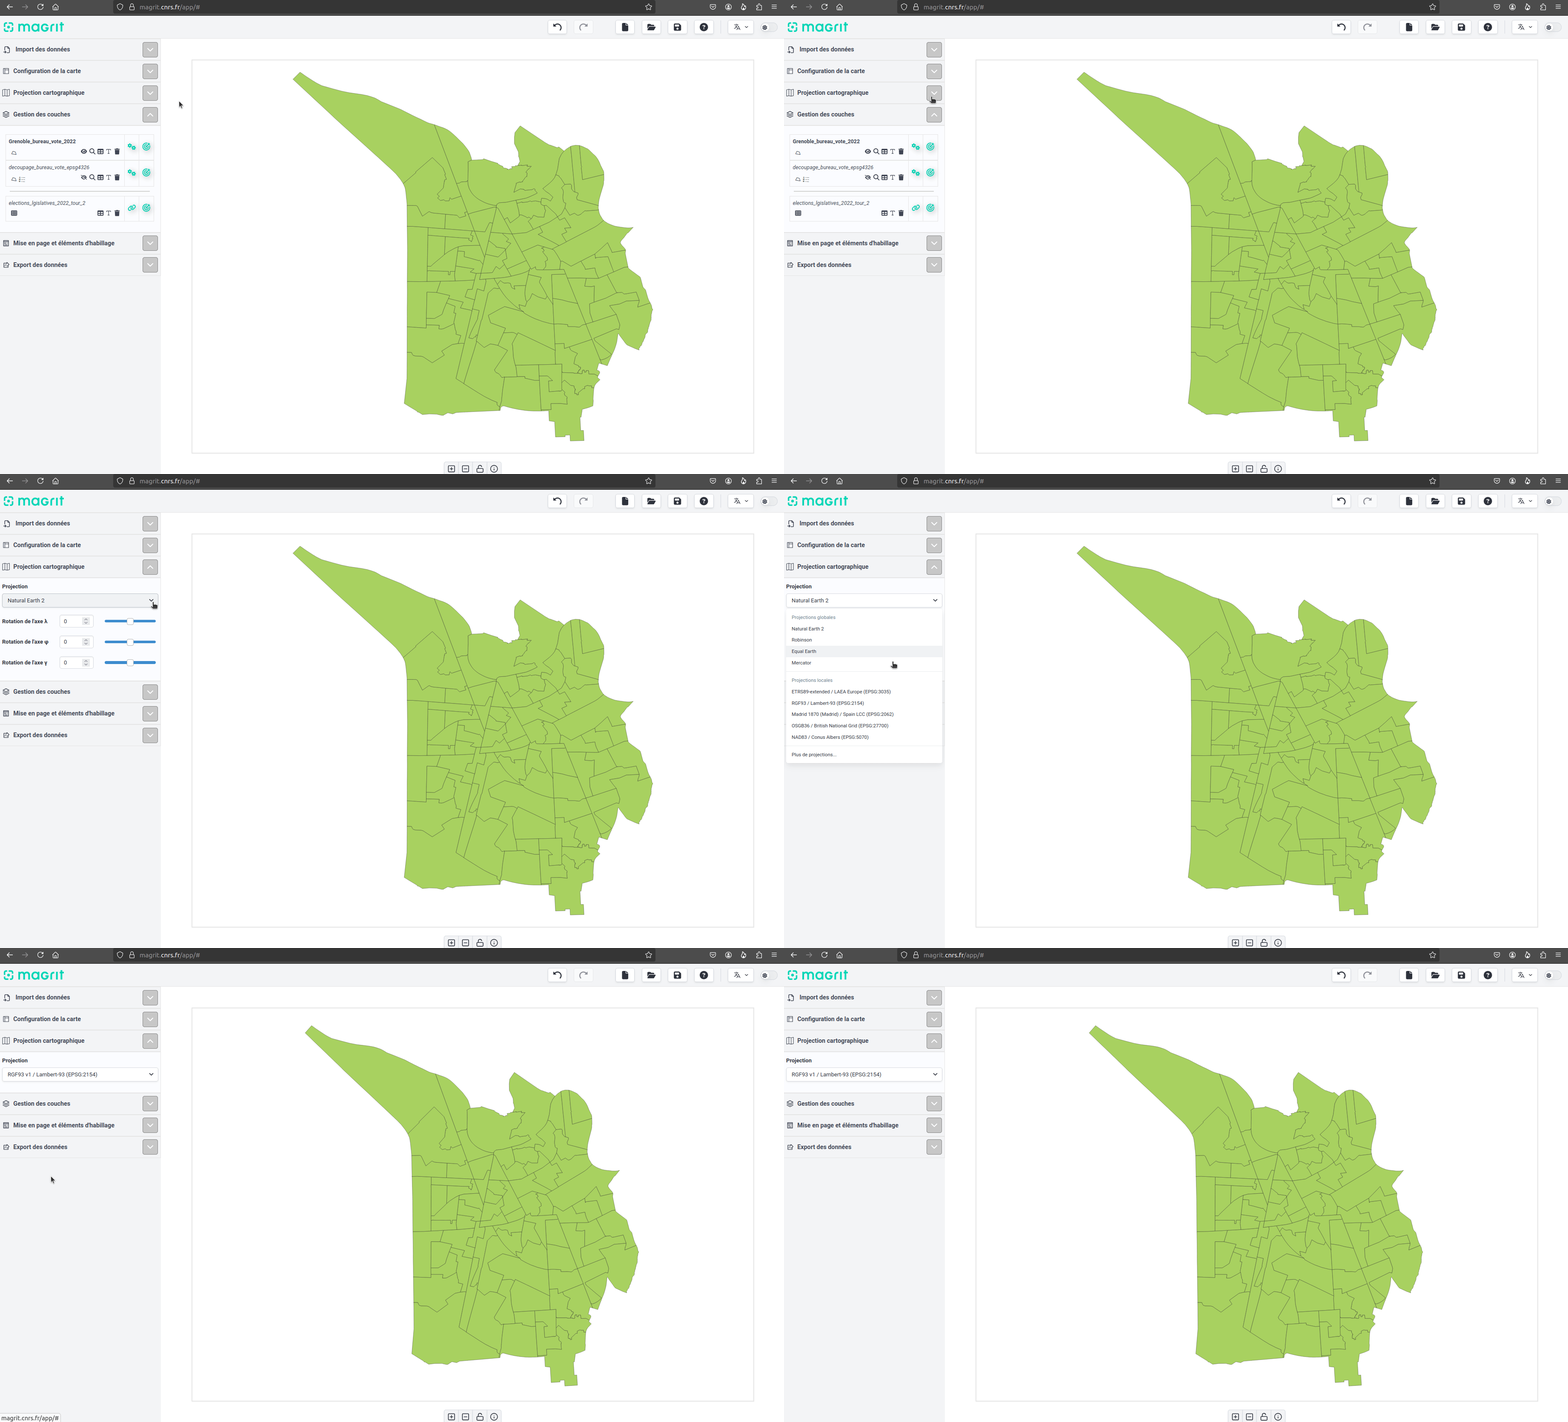 Choosing the 'RGF93 v1 / Lambert-93' map projection
4.2 Choosing the representation
We'll now choose a representation for our map. Here we'll choose a choropleth map, representing the percentage of abstention in the second round of the 2022 legislative election.
To do this, select the layer to be represented (here, the current polling stations layer with attached data), and click on the button to access the window for choosing the representation or analysis functions:
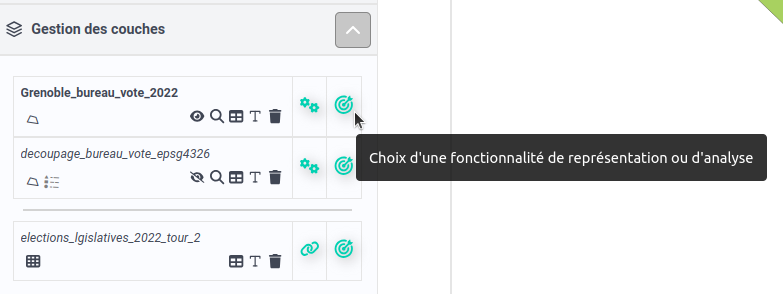 Access the display selection window
This opens a window containing some fifteen boxes: those grayed out are not available for the selected layer (for example, because the layer does not contain the data required to implement the representation in question).
For our part, we click on the "Choropleth" box to open the choropleth map settings window.
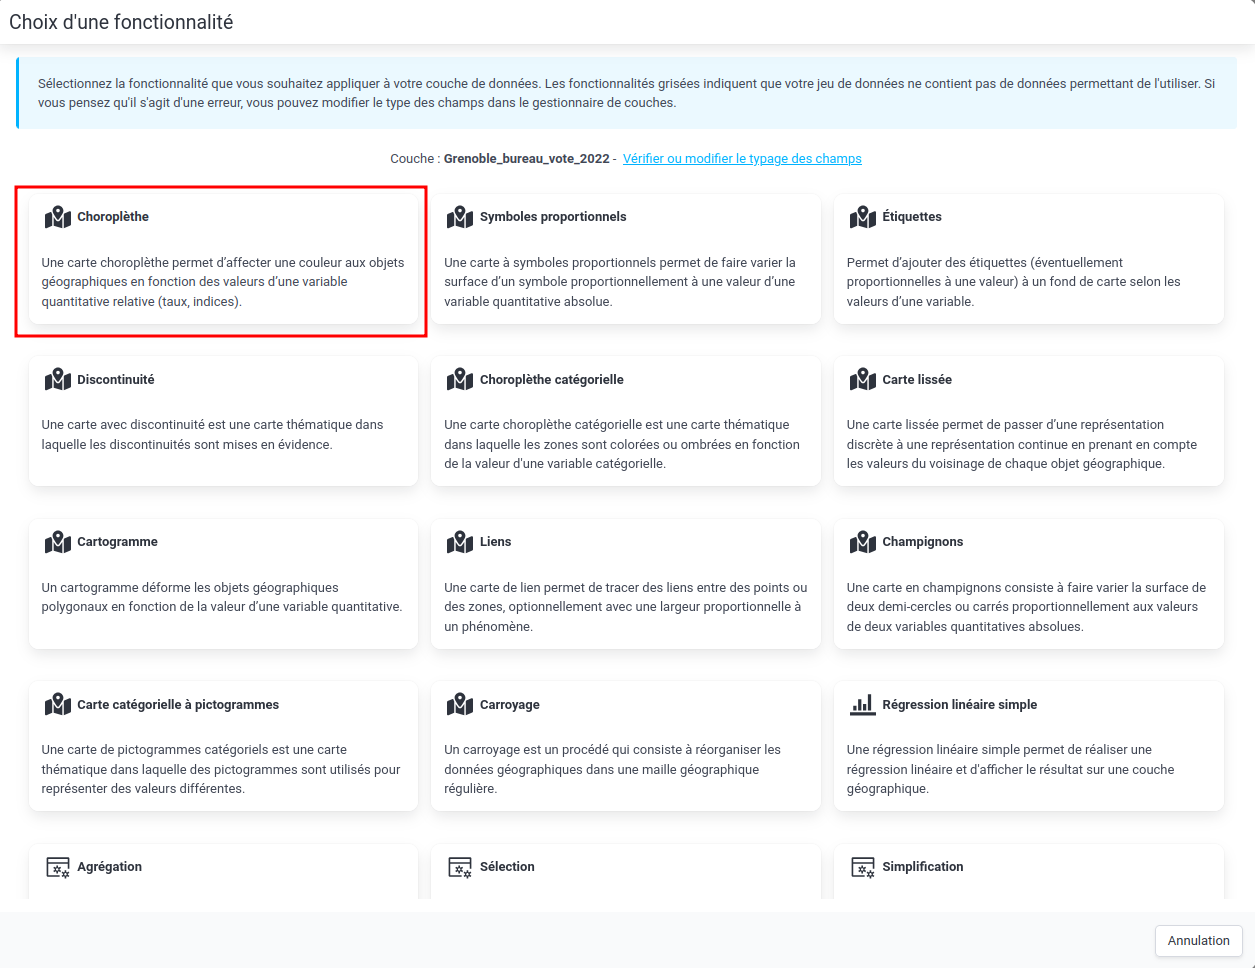 Choropleth representation selection
This window lets us choose :
- the variable to be represented (here
percentage_d_abstentions), - classification (among several shortcuts, or by opening a window dedicated to classification - which is what we're doing here).
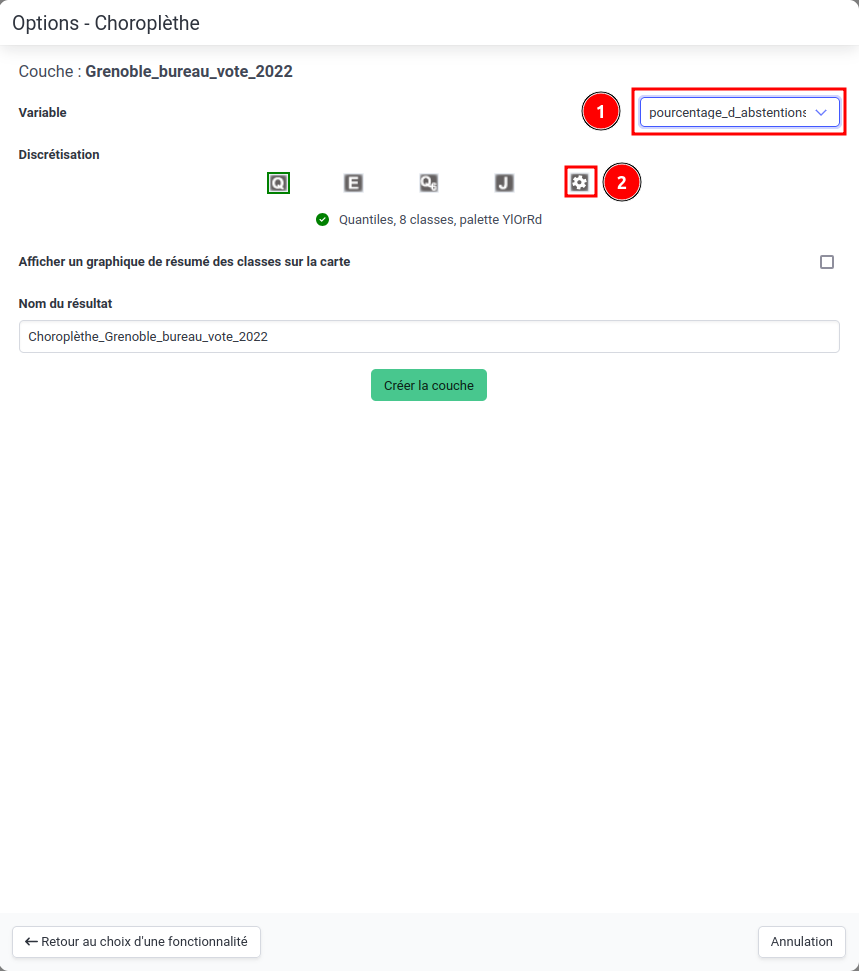 Parameters for creating a choropleth map
The classification window contains several elements to help you better understand the distribution of the values of the variable to be represented:
- a statistical summary of the variable's values (minimum, maximum, mean, median, standard deviation),
- a graph presenting a histogram of values, a density curve, a moustache box and the actual position of each value.
These elements make it possible to choose a classification method suited to the distribution of the variable's values.
In its lower half, this window contains elements for setting classification parameters:
- choice of method,
- choice of number of classes required,
- choice of color palette,
- etc. (other options may appear depending on the type of classification or palette requested).
A graph also shows the distribution of values in the classes created (as well as the number of values in each class).
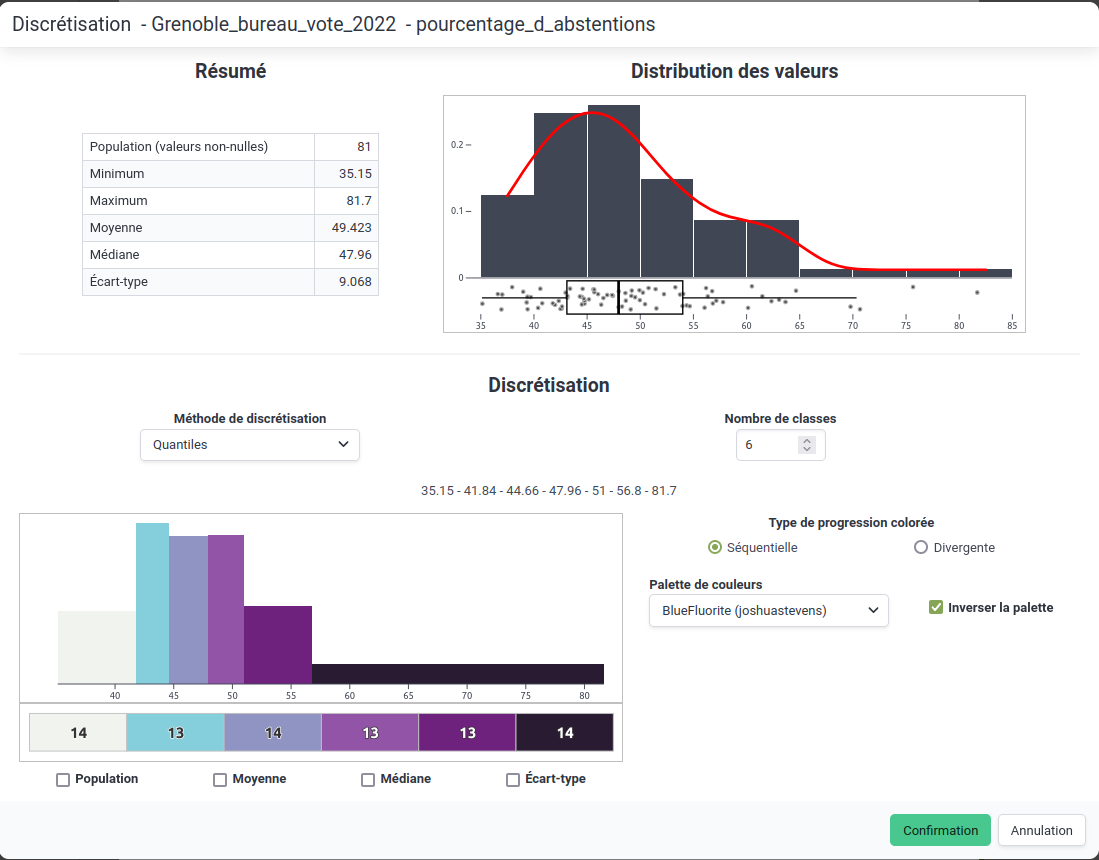 Classification parameters
Once we're satisfied with the chosen classification, we can click on "Confirmation" to validate the classification choices,
The map is then created and displayed on screen.
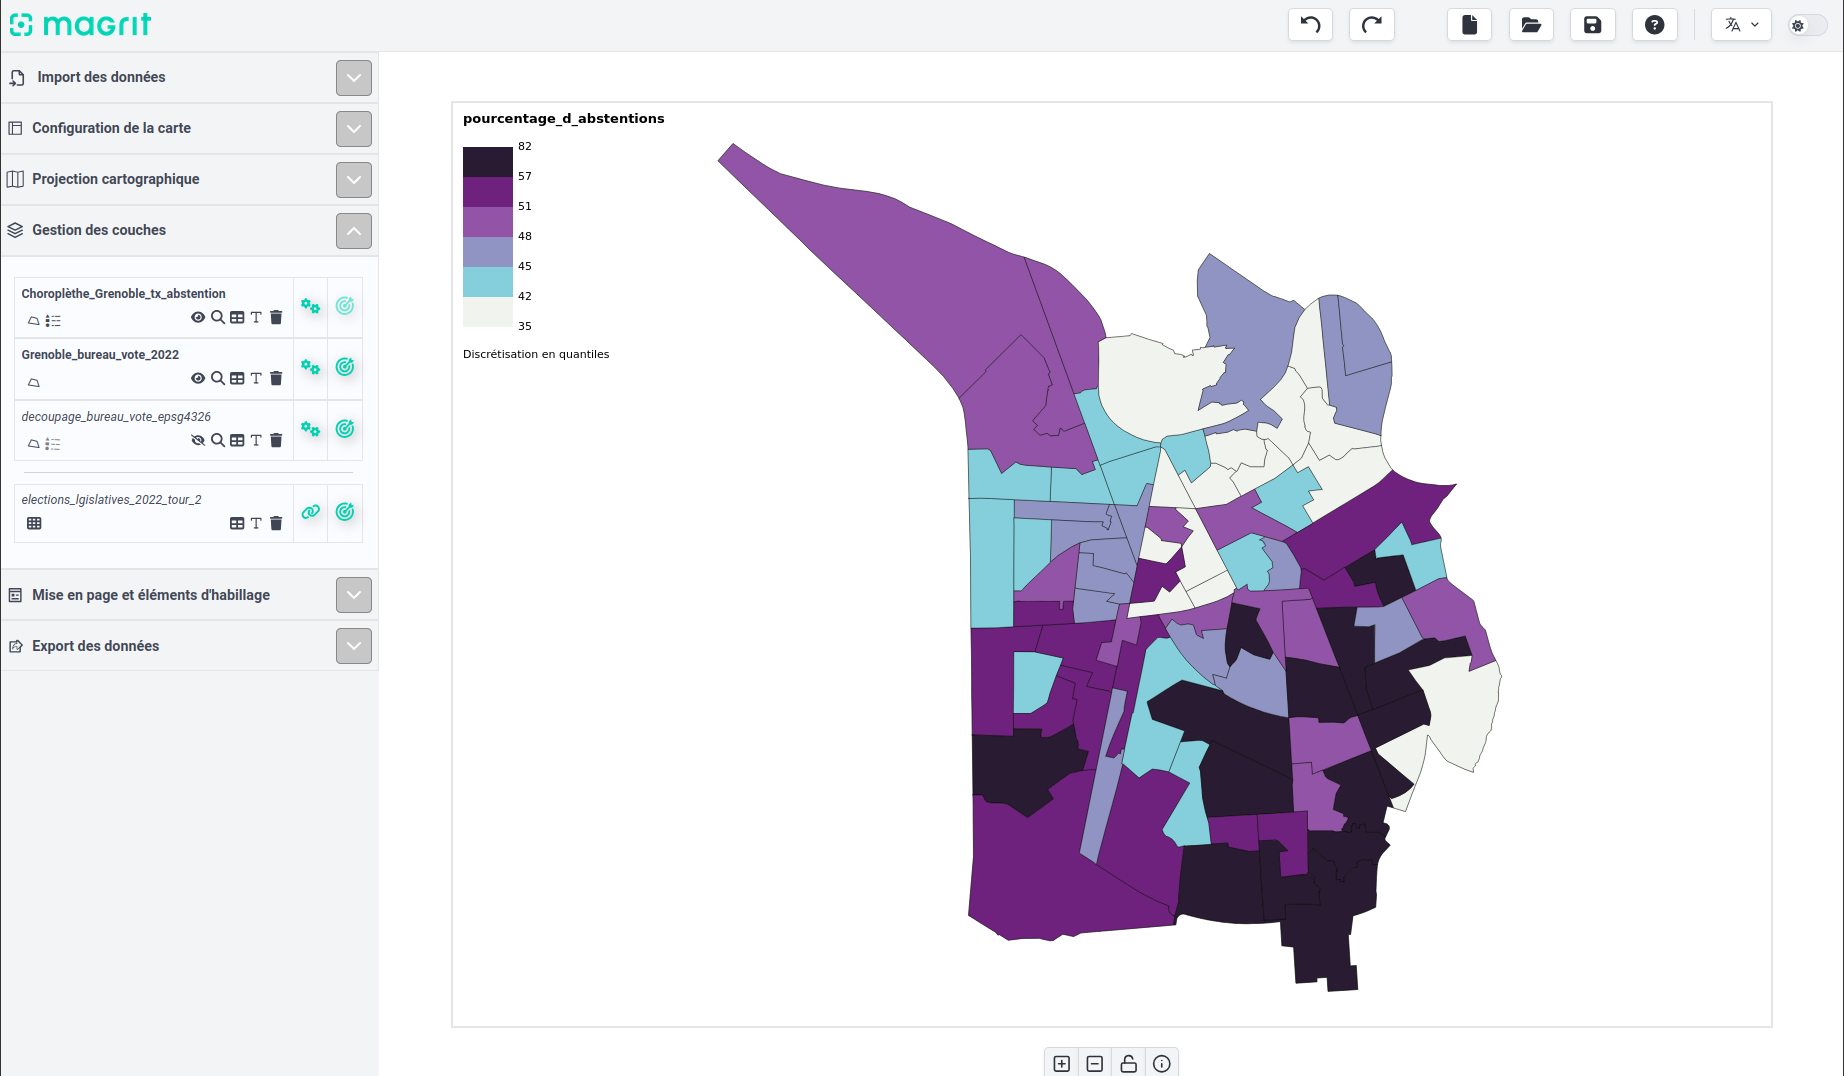 Result after creating the choropleth map
Various options are available for customizing the result, including moving and customizing the legend. A contextual menu (accessible by right-clicking on the legend) opens the legend customization window. This window can also be accessed by double-clicking on the legend.
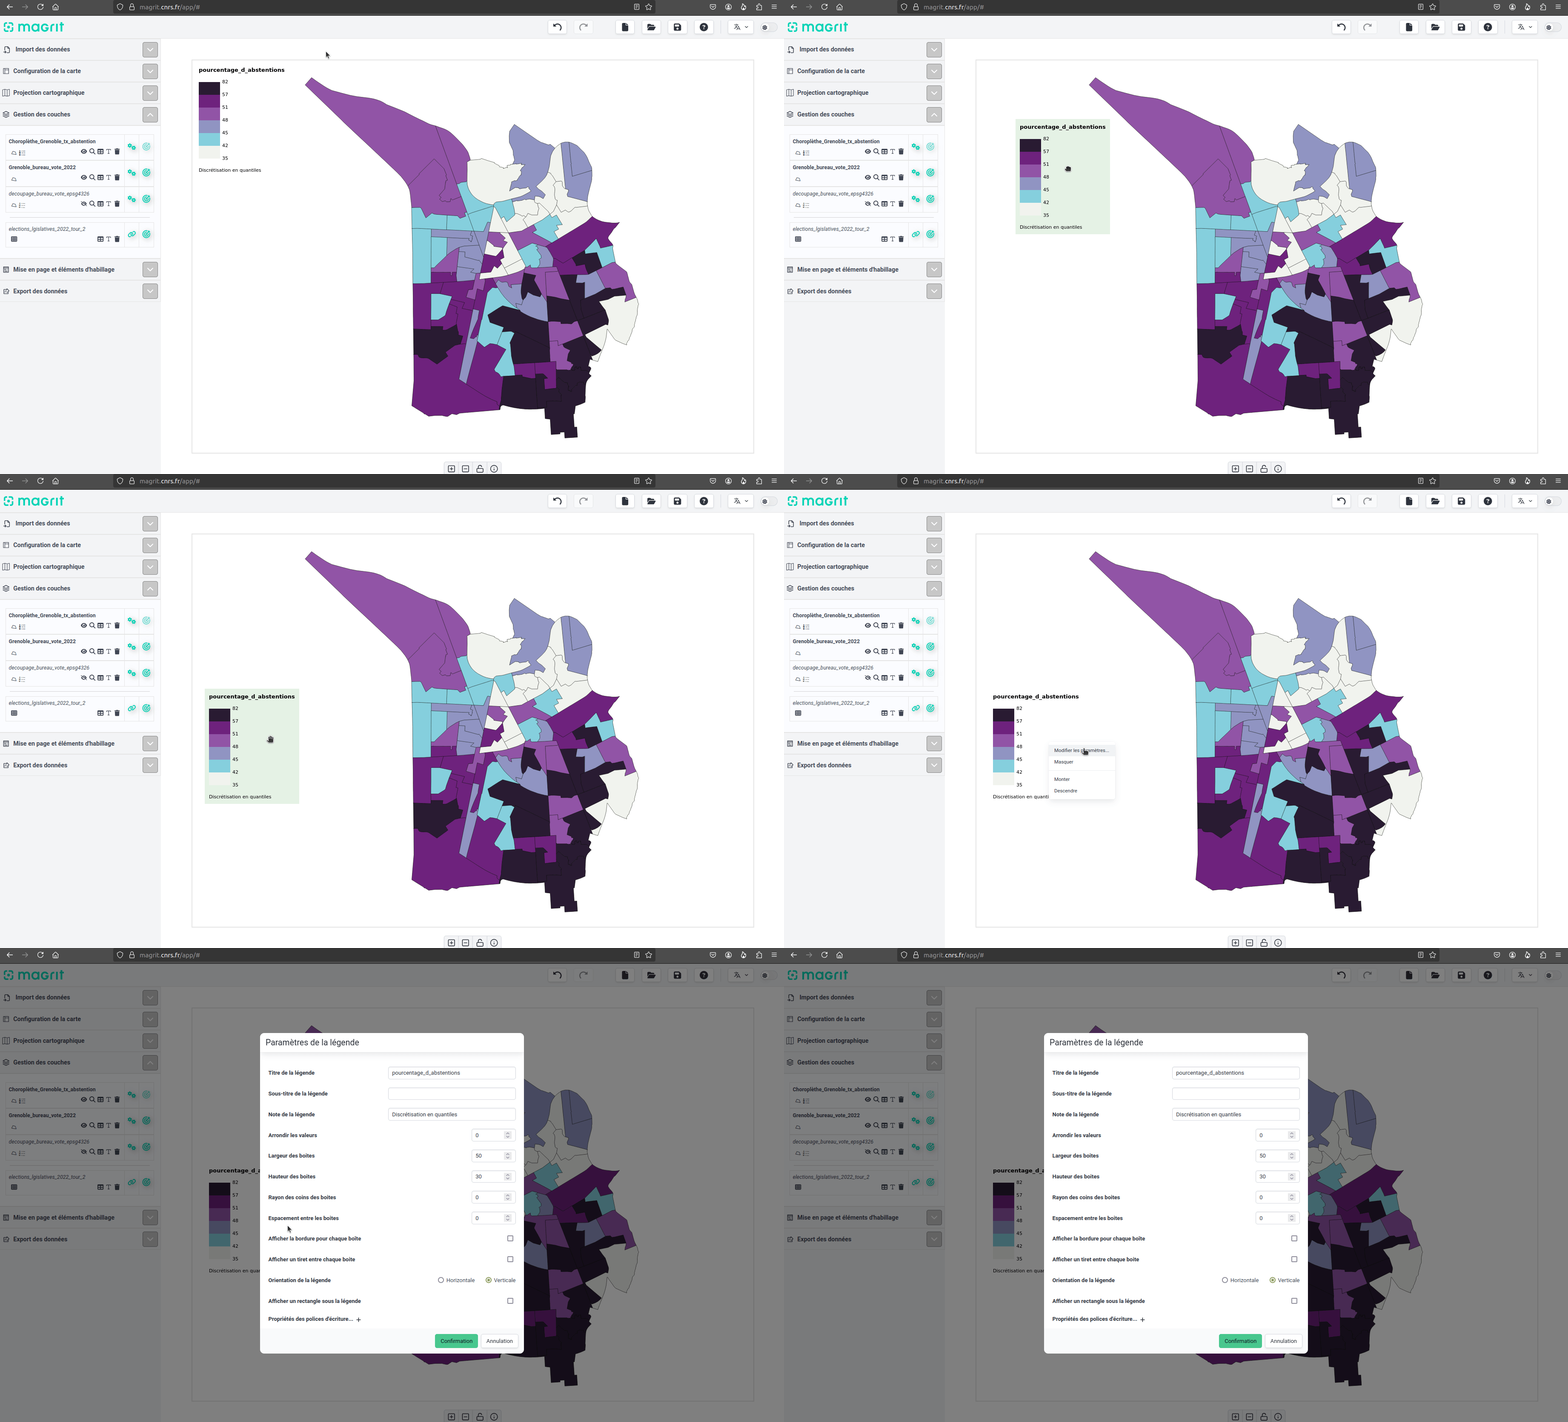 Moving the legend and opening the legend customization panel
Here, we choose to modify a number of legend elements:
- caption title,
- legend subtitle,
- legend footnote (to remove the default footnote),
- size of color blocks,
- rounding of color block corners (to create circles),
- spacing between color blocks (so that they are no longer glued together, as is the default),
- size of various text elements (title, subtitle and class labels).
It's these choices that create a more legible and aesthetically pleasing legend (or at least, one that more closely matches our expectations):
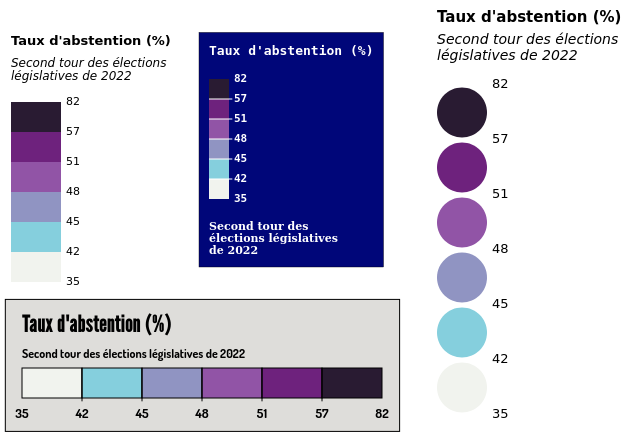 Examples of custom legend
It is also possible to customize various parameters of the choropleth map just created by clicking on the "Parameters" button in the layer manager:
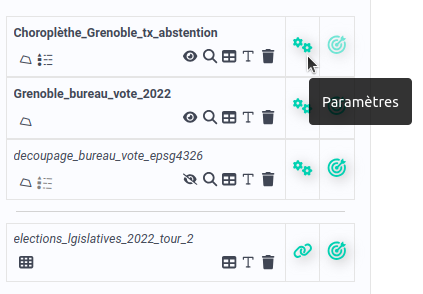 Access layer parameters
This window lets you modify general parameters (layer opacity, color, border thickness and opacity, adding a shadow to the layer, etc.) as well as all discretization parameters chosen when creating the choropleth map (number of classes, classification method, color palette, etc.).
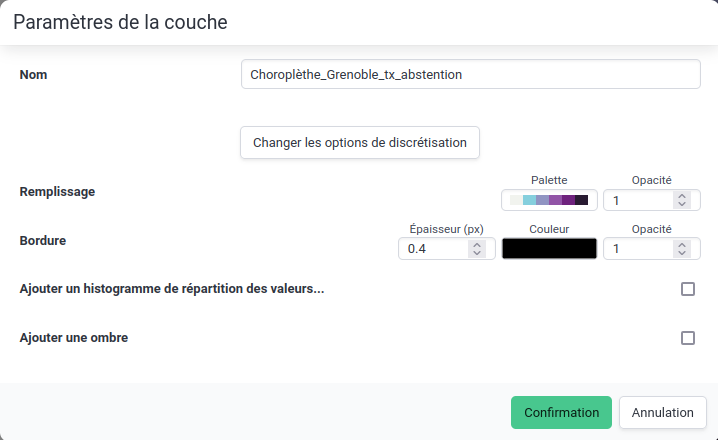 Layer parameters
Here we choose :
- to change the border color to gray,
- to add a shadow to the layer to visually separate it from the map background.
5. Map design
Once the map is satisfactory, it can be enhanced to make it more legible and aesthetically pleasing.
In the left-hand side menu, you can access the "Layout and design elements" section. This allows you to perform various actions:
- add a title and source to the map (these are simply text zones, already positioned),
- choice of background color,
- addition of various traditional elements :
- arrow or broken line,
- rectangle or circle,
- north arrow,
- graphic scale,
- text box,
- your choice of image or symbol,
- freehand drawing.
In our case, we choose to add a title to the map, retaining its original positioning:
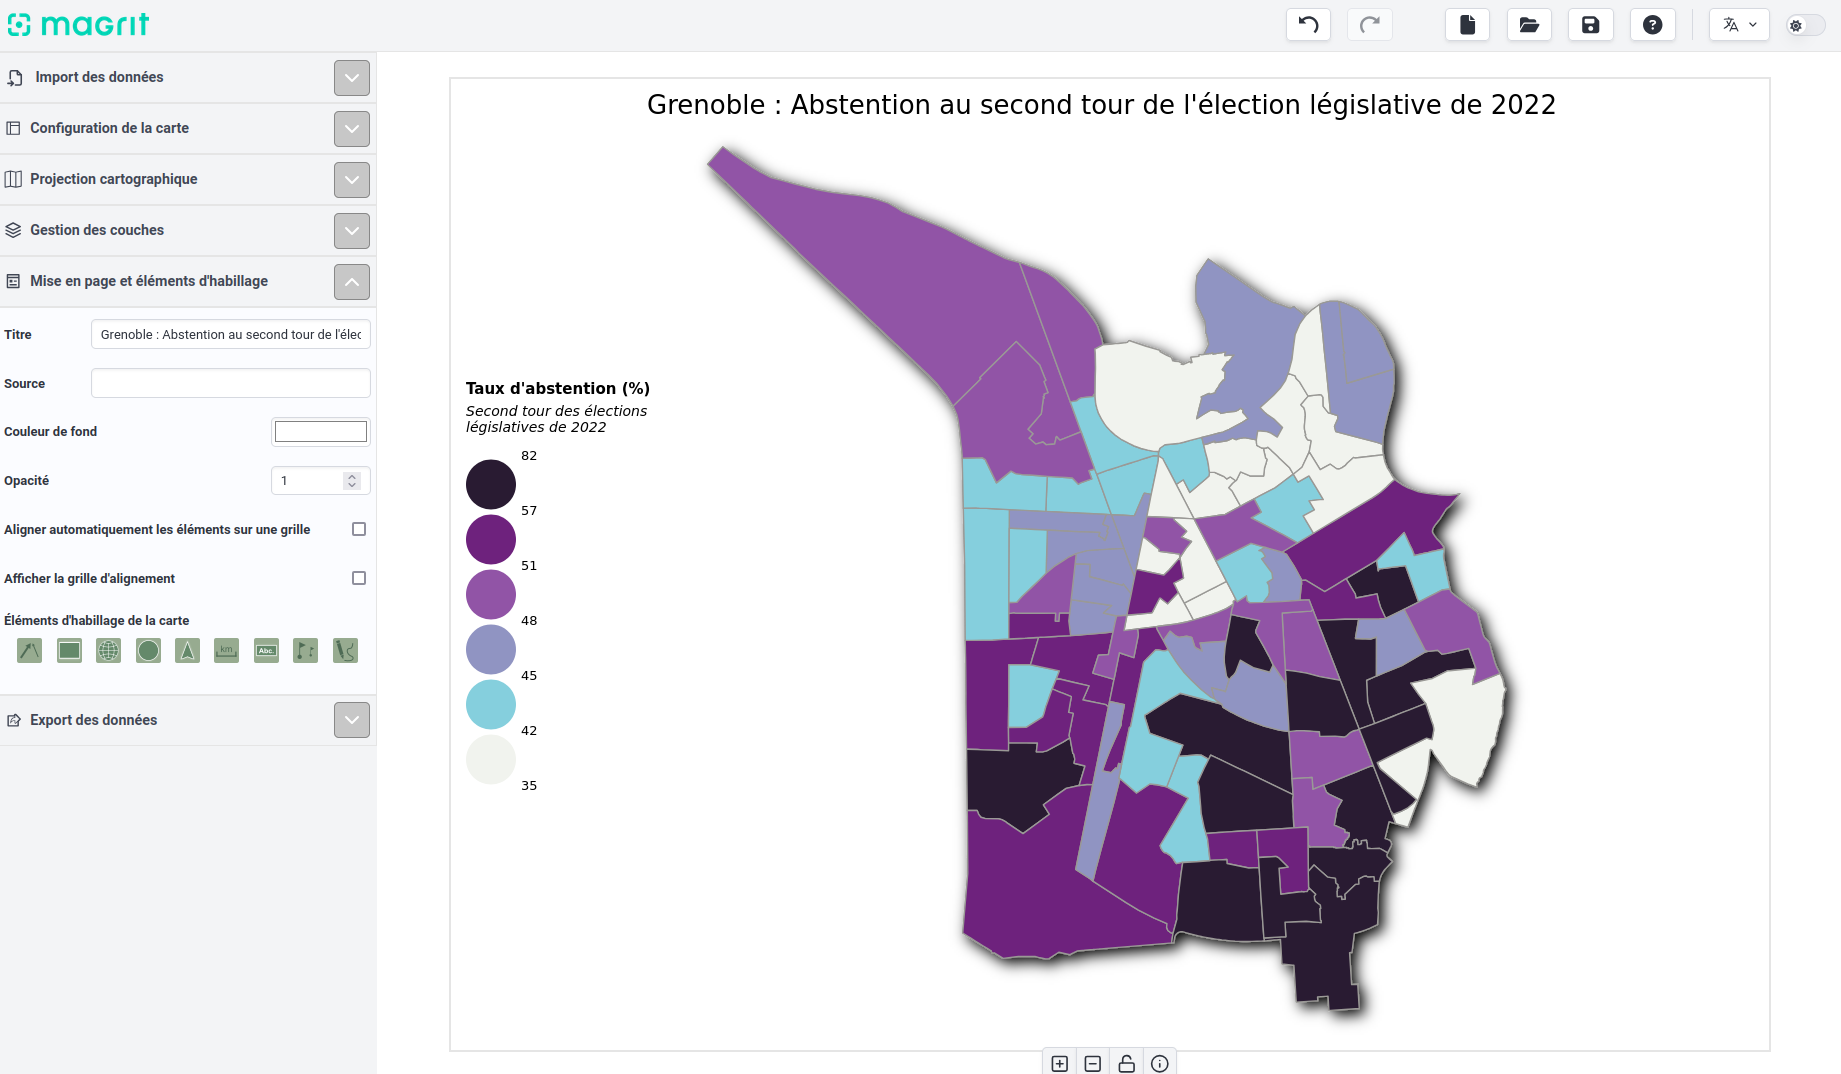 Layout and design elements - map title
We also choose to add a margin around the map, to accommodate the title and data source, without these interfering with the map itself.
You can choose the size of each margin (top, bottom, right, left) in pixels, and define a color and opacity for the margin.
In our case, we're only adding a margin at the top and bottom.
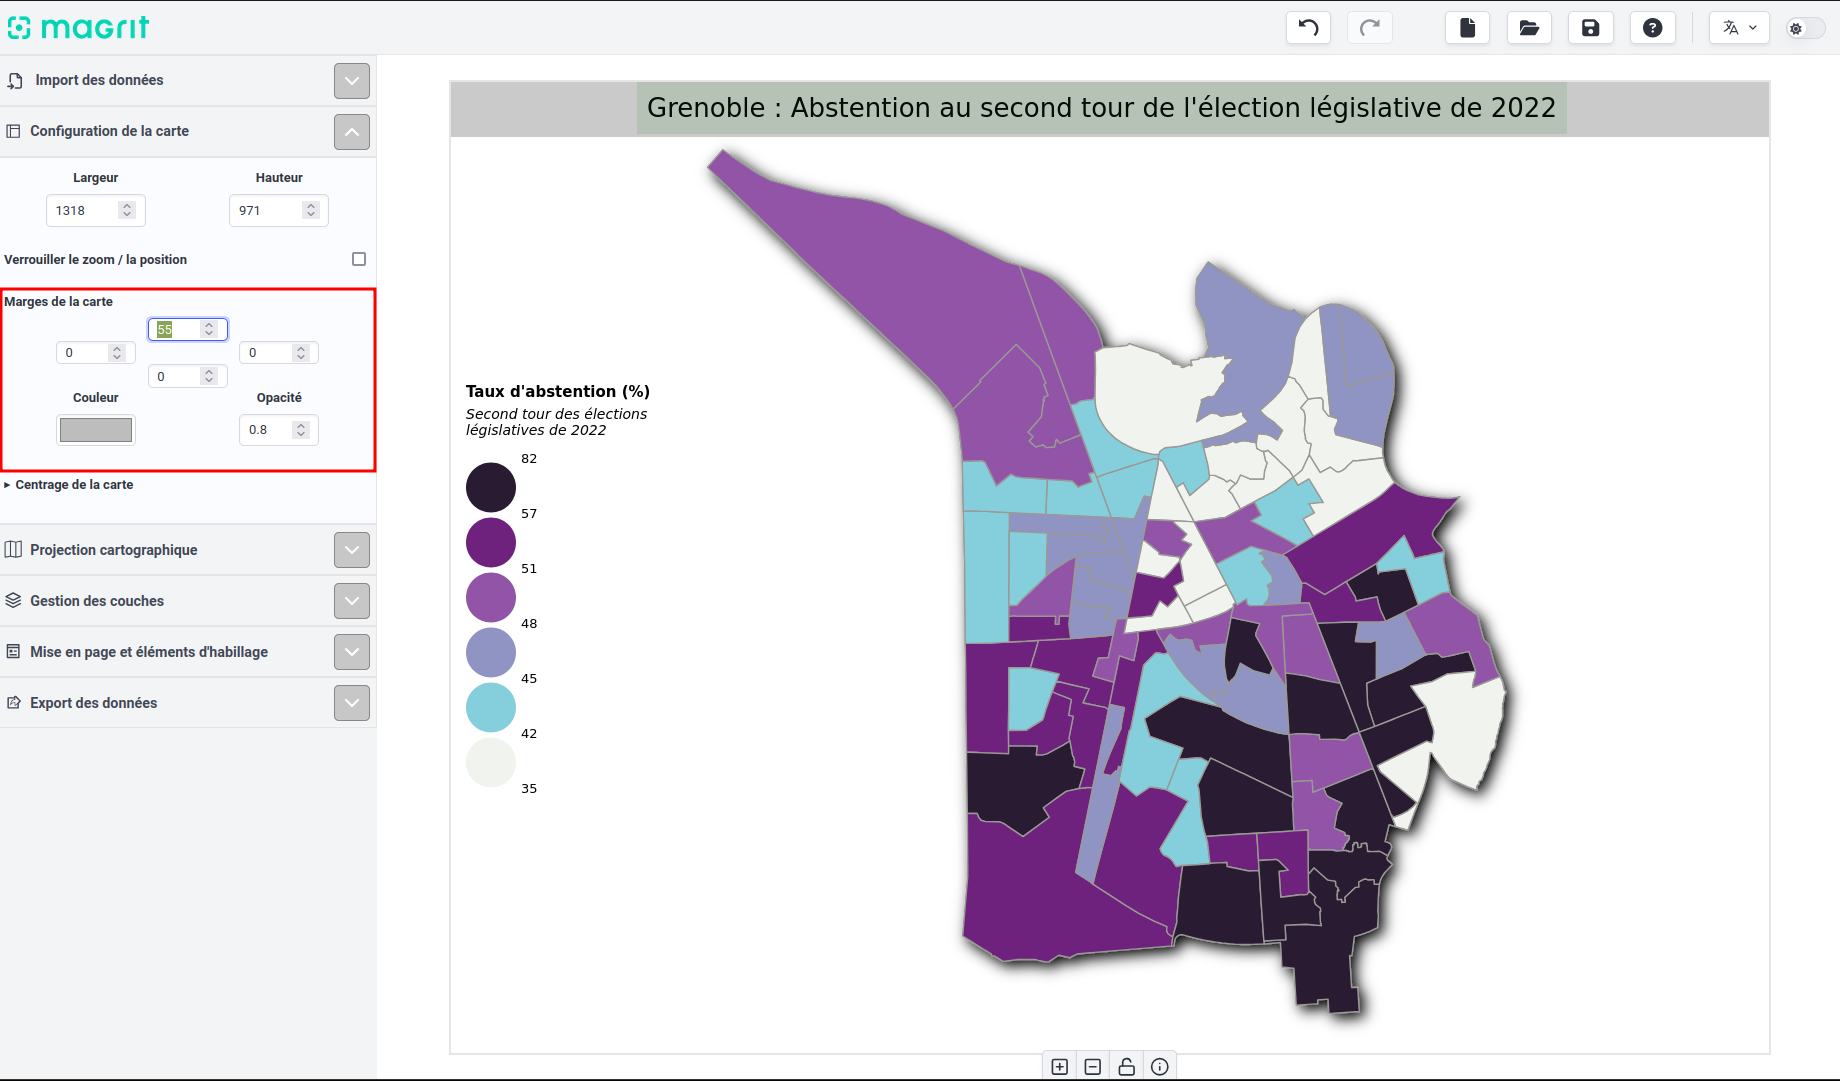 Adding margins around the map
We then use the "text box ‘ and ’broken line " functionalities to indicate 3 places of interest on the map: these are the 3 polling stations with the highest abstention rate in the second round of the 2022 legislative election.
6. Exporting the map
Once you're satisfied with the result, you can export the resulting map :- PNG (choose the pixel size - the default is the current map size),- SVG.
Since we don't want to retouch the map a posteriori in a vector drawing program, we'll choose to export it in PNG.
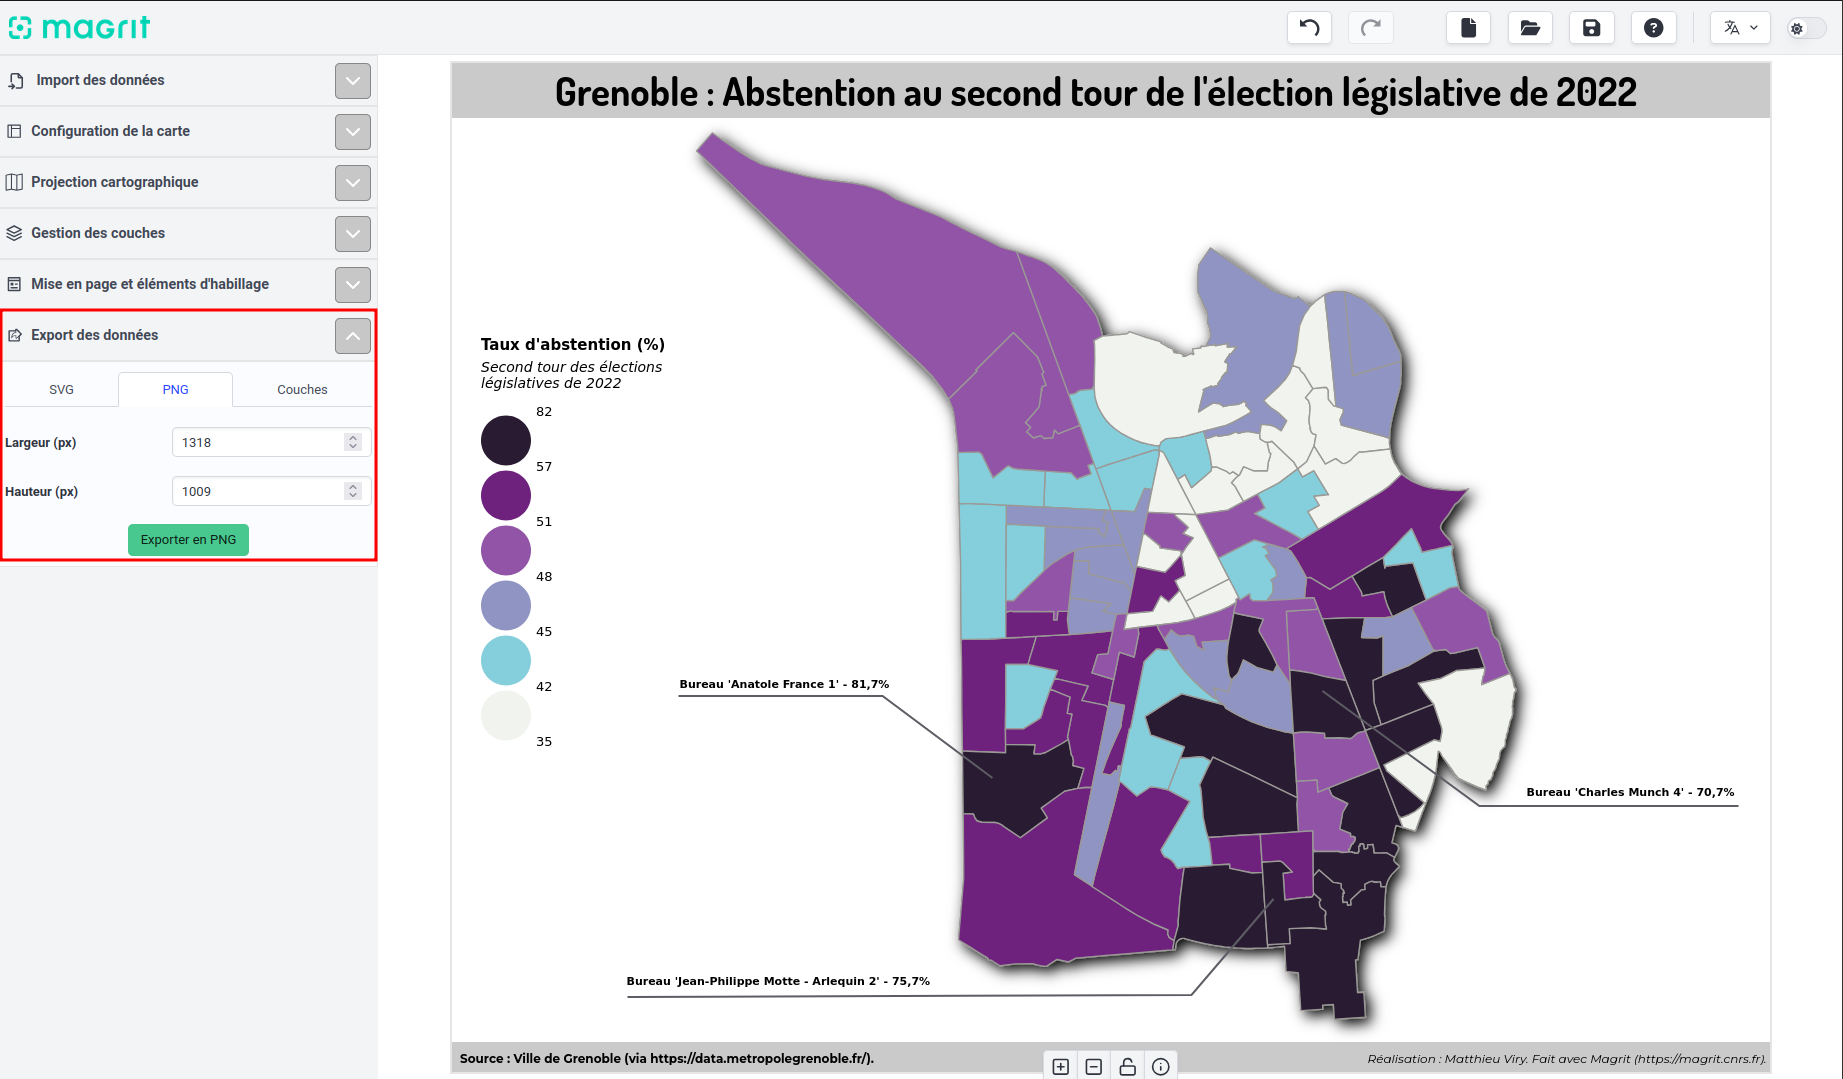 Map export options
The exported map is faithful to the one displayed on screen, and can be used in a report, presentation or any other document:
 Finalised map, exported in PNG format