Discontinuity
Discontinuity maps highlight the limits (or "boundaries") between the entities studied, by assigning them a thickness relative to the value differential existing between them.
Two methods are used to calculate this differential:
- absolute discontinuity: absolute difference between the values of the variable studied, i.e.
max(A,B) - min(A,B). - relative discontinuity: relative difference between the values of the variable studied, i.e.
max(A,B) / min(A,B).
The visualization of discontinuity lines highlights the spatial breaks in the socio-economic phenomena studied, which, in the words of Brunet and Dolphus (1990), show that "geographical space is fundamentally discontinuous ".
This representation is particularly relevant when combined with a solid color representation (Cf. choropleth map).
Parameters
- Variable to use
- Type of discontinuity (absolute or relative)
- Type of discretization
It is possible to modify, after creating the layer, the discretization parameters (number of classes, discretization method, size associated with each class, etc.).
Example
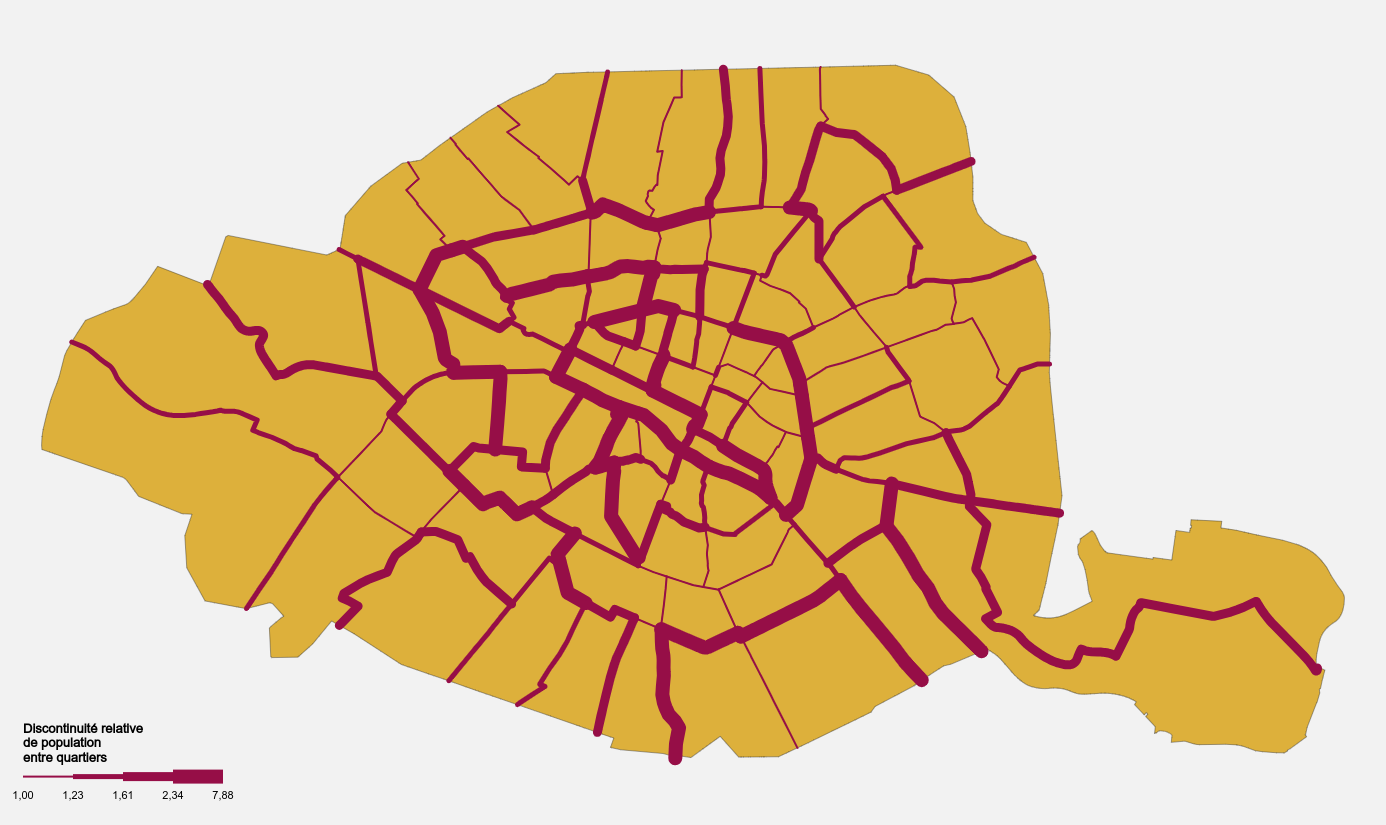 Example of discontinuity map