Classification panel
Several methods are proposed for transforming a continuous series of values into a discrete series, i.e. into a finite number of classes.
When creating a choropleth representation, the number of classes and their limit values must be justified statistically and/or thematically.
The methods proposed by the tool can be used as they stand, or as reading and analysis guides prior to manual entry of the desired class limits.
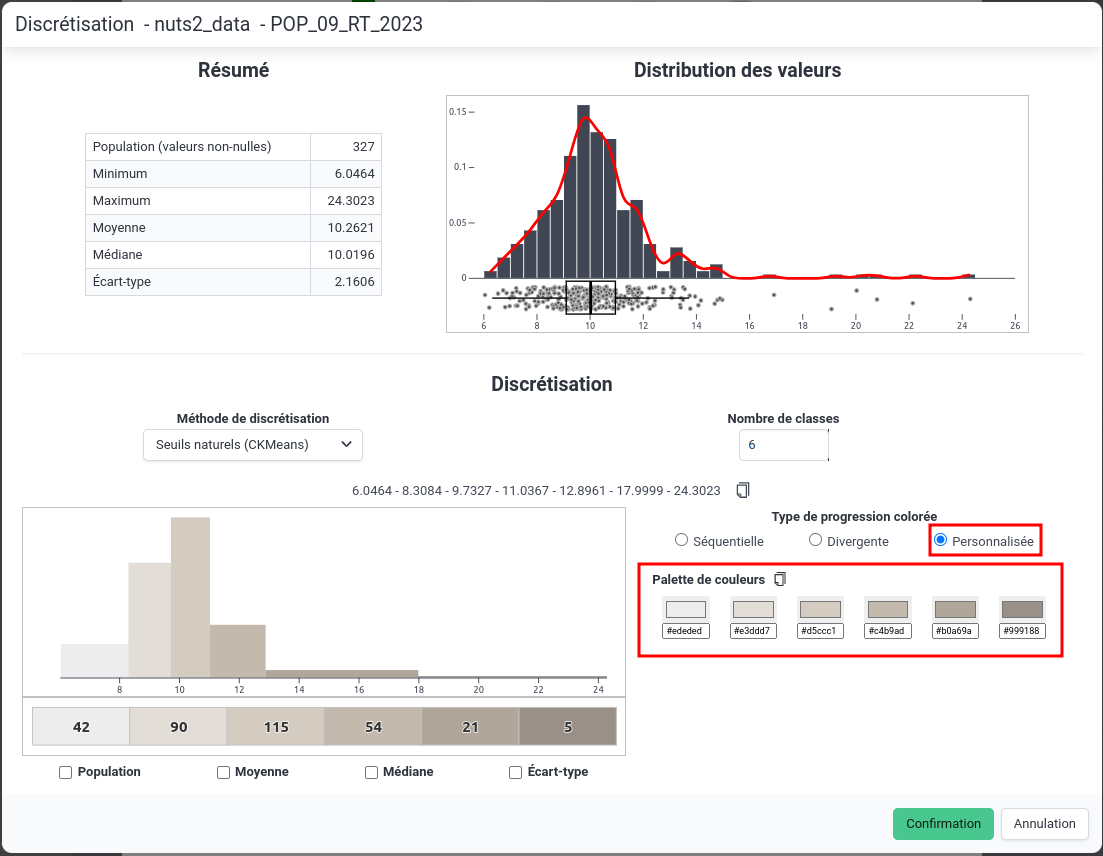
Overview of the classification panel
 Classification panel
Several elements are present in this window:
- A summary of the series of values to be classified (number of non-zero values, mean, median, minimum, maximum, etc.),
- A graphical overview of the distribution of values (histogram, density curve and whisker box),
- A section dedicated to classification (choice of method, number of classes, choice of color palette and visualization of the number of entities per class).
Classification methods
Quantiles
This method, sometimes also described by the term "classification into classes of equal frequencies", allows the formation of classes that all have the same number of entities.
Equal intervals
This method, sometimes also called "equal amplitudes", allows the creation of classes that all have the same range.
Q6
This method (popularized by the PhilCarto tool), allows classification according to the quartile method while isolating extreme values: it thus produces 6 classes. The 6 classes are defined with the following limits: minimum, percentile 5 (0.05%), 1st quartile (25%), median (50%), 3rd quartile (75%), percentile 95 (95%), maximum.
Natural breaks (CKMeans algorithm)
This method allows the creation of homogeneous classes. Indeed, the algorithm aims to find the desired number of classes by minimizing the intra-class variance and maximizing the inter-class variance.
In this method, class boundaries fall halfway between two data points.
Natural breaks (Fisher-Jenks algorithm)
This method allows the creation of homogeneous classes. Indeed, the algorithm aims to find the desired number of classes by minimizing the intra-class variance and maximizing the inter-class variance.
Usually (i.e. using other Fisher-Jenks implementation), class boundaries fall on data points, but we have chosen to return “prettier” class boundaries that fall halfway between two data points.
Deprecation
This method is now deprecated in favor of the CKMeans method, which gives better results (entities are usually classified as in the Fisher-Jenks method) in a much shorter calculation time. We therefore recommend using the CKMeans method instead.
Mean and standard deviation
This method proposes to form classes based on the value of the standard deviation and the mean. This method of classification does not allow you to directly choose a number of classes, but allows you to choose the portion of the standard deviation which corresponds to the size of a class as well as the role of the mean (used as a class boundary or as a class center).
Geometric progression
This classification method allows you to create classes whose limits are defined by a geometric progression: each class is defined by a multiple of the previous one.
Head/tail breaks
This classification method can be used to create classes for series that are very unbalanced on the left (with many low values and a few very high values).
Nested means
The nested means method is used to create classes in a hierarchical fashion. Each class is defined by the average of the values of the parent class.
The number of classes that can be chosen for this method is therefore necessarily a power of 2 (2, 4, 8, etc.).
User-defined
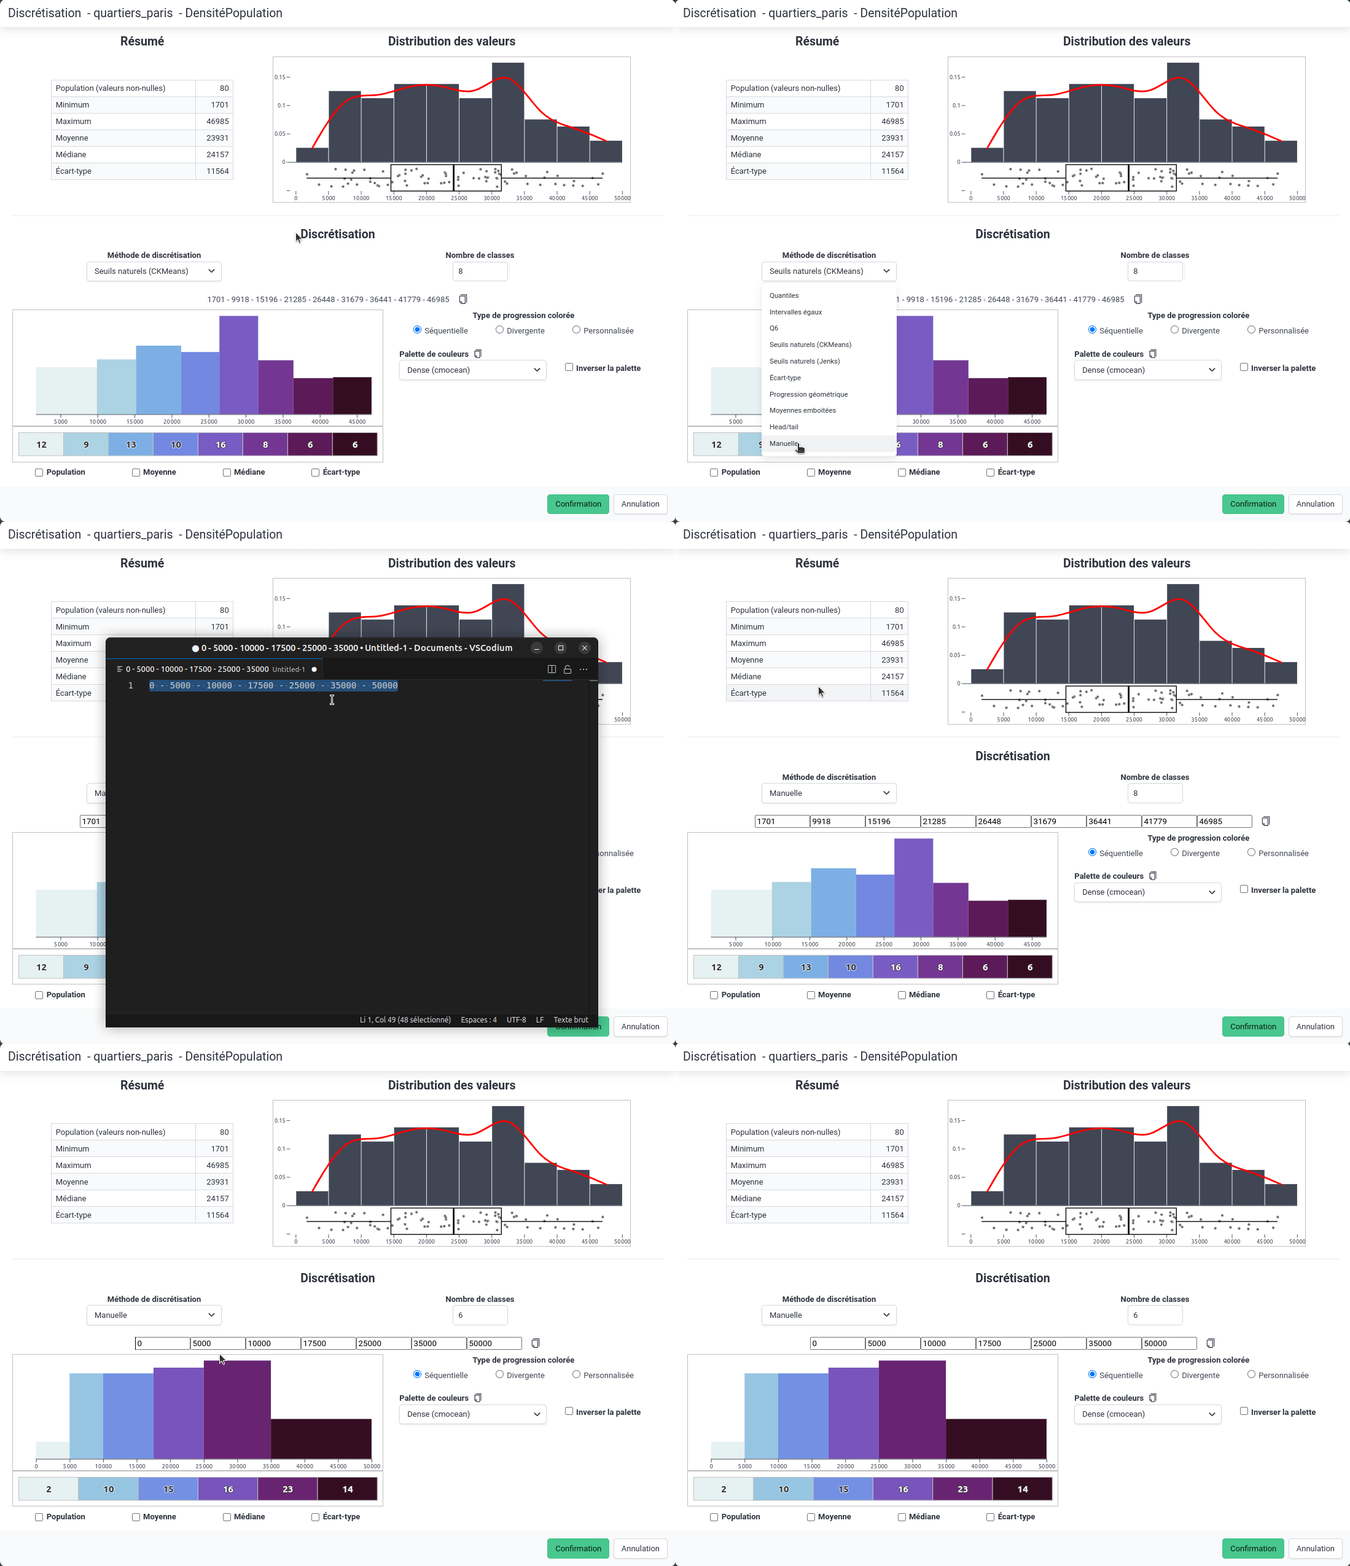
This method allows you to define the class boundaries manually.
This method can be particularly useful for :
- creating “pretty” class boundaries, or at least adjusting them, after automatic classification with quantiles or natural breaks for example,
- reuse class boundaries already defined in another context for map comparison.
Note that class boundaries separated by dashes can be pasted from the clipboard (for example: 0 - 10 - 20 - 30 - 40), as shown in the image below.
 Manual entry of class boundaries
Choosing a color progression
Two types of color progression are available in Magrit:
- Sequential palettes: used to represent continuously ordered data.
- Divergent palettes: used to represent data ordered around a central value (e.g., an average, or the value zero, etc.).
The available color palettes are taken from the dicopal library which offers palettes from a wide range of suppliers: ColorBrewer, Fabio Crameri's Scientific Colour Maps, CartoColors, CmOcean, Matplotlib, Light & Bartlein, MyCarta, Tableau, Joshua Stevens, etc.
These palettes can be generated for any number of classes. For divergent palettes, options allow you to choose whether or not a central (neutral) class should be present, and the position of this class (or of the inflection point, if applicable), enabling you to generate asymmetrical divergent palettes.
You can also choose a custom color palette by clicking on the “Custom palette” option (see below).
 Custom color palette
Selection of interval closure direction
In the application's general options modal, you can choose the interval closure direction for representations using classification (choropleth maps, discontinuity portrayal, etc.).
This option lets you choose whether classes are closed :
on the left (e.g. for class boundaries
1 - 3 - 5 - 8 - 10, intervals are[1, 3[,[3, 5[,[5, 8[,[8, 10])on the right (so for class limits
1 - 3 - 5 - 8 - 10, the intervals are[1, 3],]3, 5],]5, 8],]8, 10])
Note that this option is not located in the classification panel specific to each layer, as it applies to all maps produced in the application.
Note also that this option is generally of no consequence to the classification of individuals - some classification methods (Jenks, CKMeans) propose class boundaries located halfway between two data values.