Proportional symbols
These maps allow you to represent stock data (or absolute quantitative data) with proportional symbols. The size of the symbols is proportional to the value of the variable to be represented.
Stock data examples include the number of inhabitants, the number of companies, the yield of a crop, etc.
Symbol choice
The following symbols can be used:
- Circle
- Square
- Line (for linear data only)
Symbol positioning depends on the geometry of the entities in the data layer:
- for point features, symbols are positioned on points,
- for linear entities, "circle" and "square" symbols are positioned at the center of the line, and "line" symbols are positioned along the line,
- for surface entities, "circle" and "square" symbols are positioned at the center of the surface.
Symbol overlap
When selecting "circle" or "square" symbols, you can choose whether or not the symbols are allowed to overlap.
By default, the symbols are allowed to overlap (since they are positioned at the center of the entities).
If the "avoid overlapping" option is activated, symbols are moved to avoid overlapping.
Symbol color
The color of the symbols can be:
- Unique: all symbols have the same color,
- Relative quantitative variable: the color of the symbols varies according to the value of the variable to be represented, as in a choropleth map,
- Qualitative variable: the color of the symbols varies according to the value of a qualitative variable.
Examples
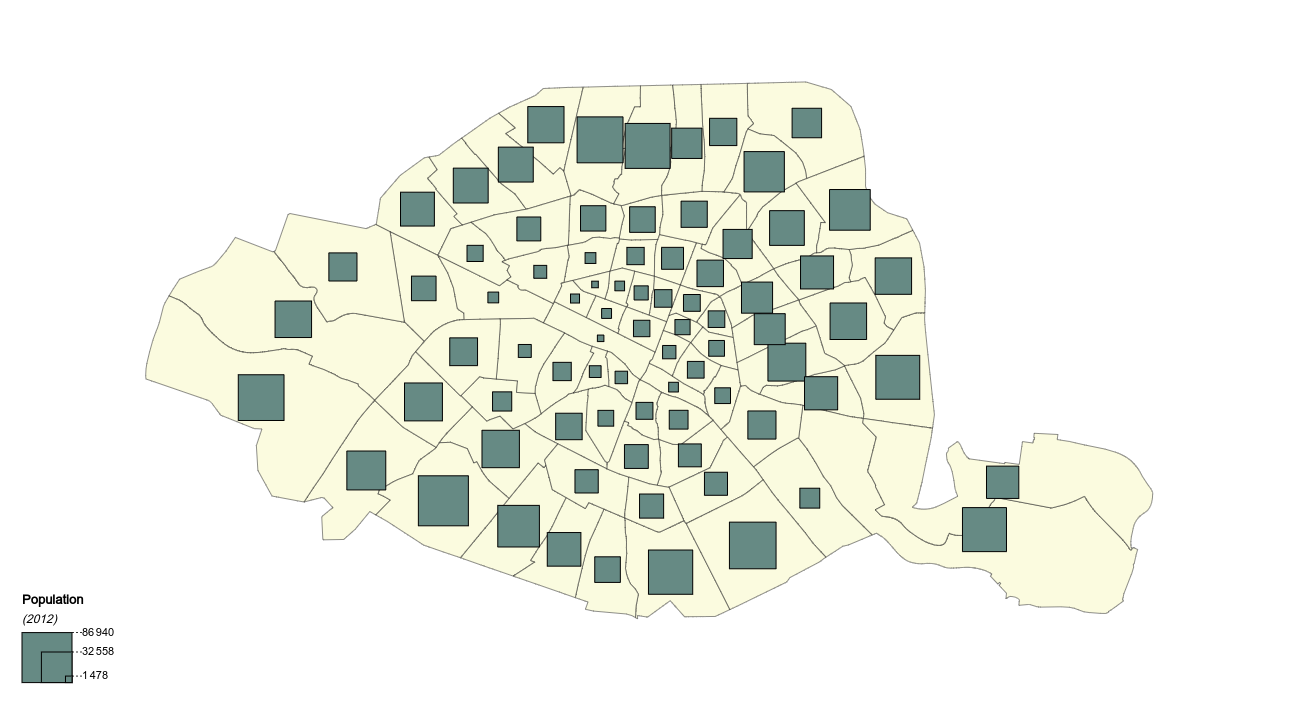 Proportional symbols map (unique color)
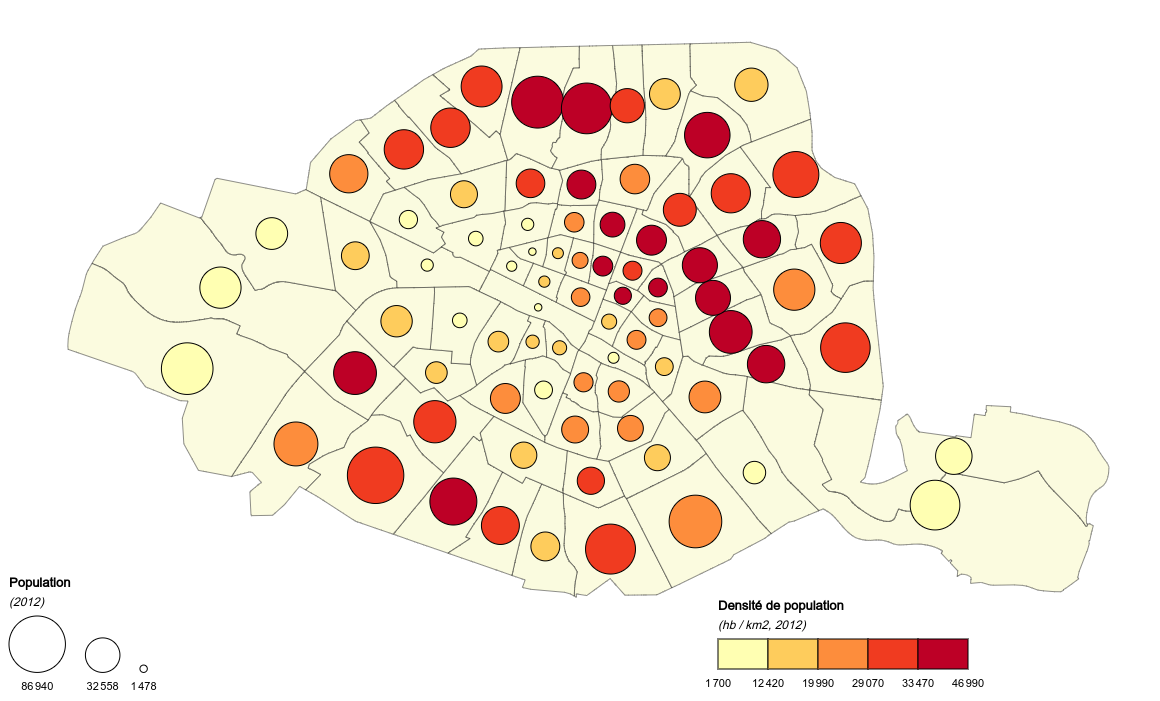 Proportional symbols map (coloration by quantitative variable)
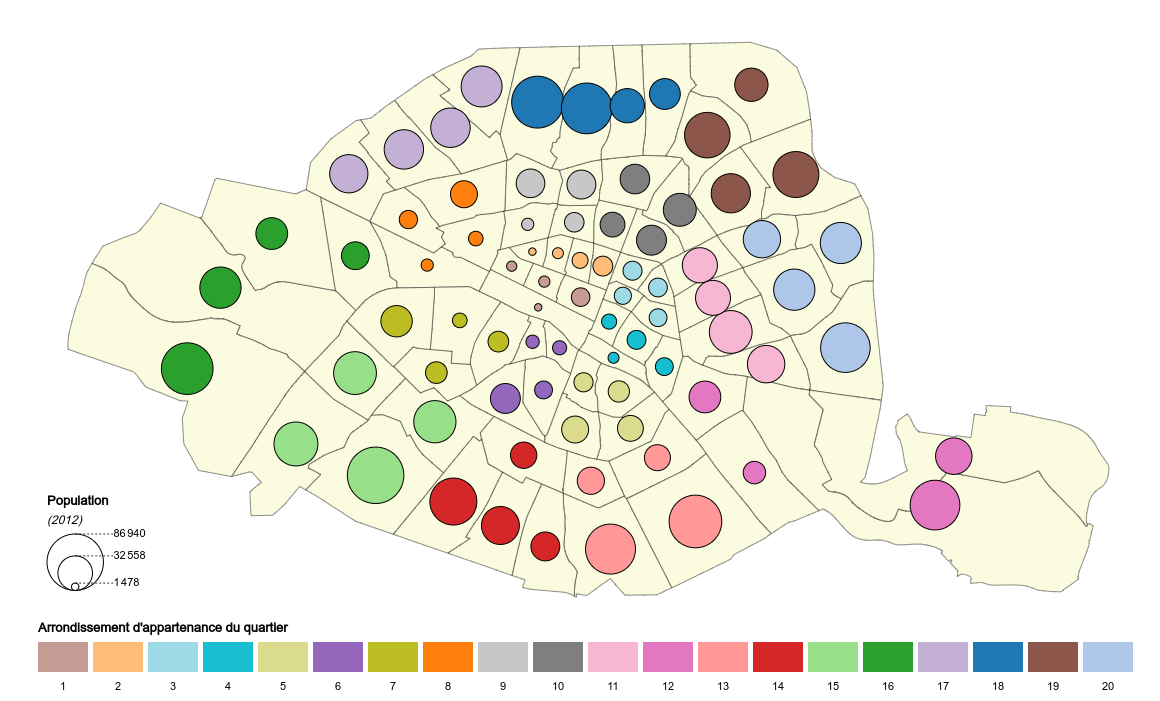 Proportional symbols map (coloration by qualitative variable)