Simple linear regression
Magrit proposes to perform a simple linear regression between the values contained in two columns of a geographic dataset.
Simple linear regression is a statistical method that models a linear relationship between two variables (a dependent variable and an independent variable) by means of a straight line.
This line is defined by an equation of the form y = a * x + b, where y is the dependent variable, x is the independent variable, a is the directing coefficient of the line and b is the y-intercept.
This explains the extent to which one phenomenon is influenced by another.
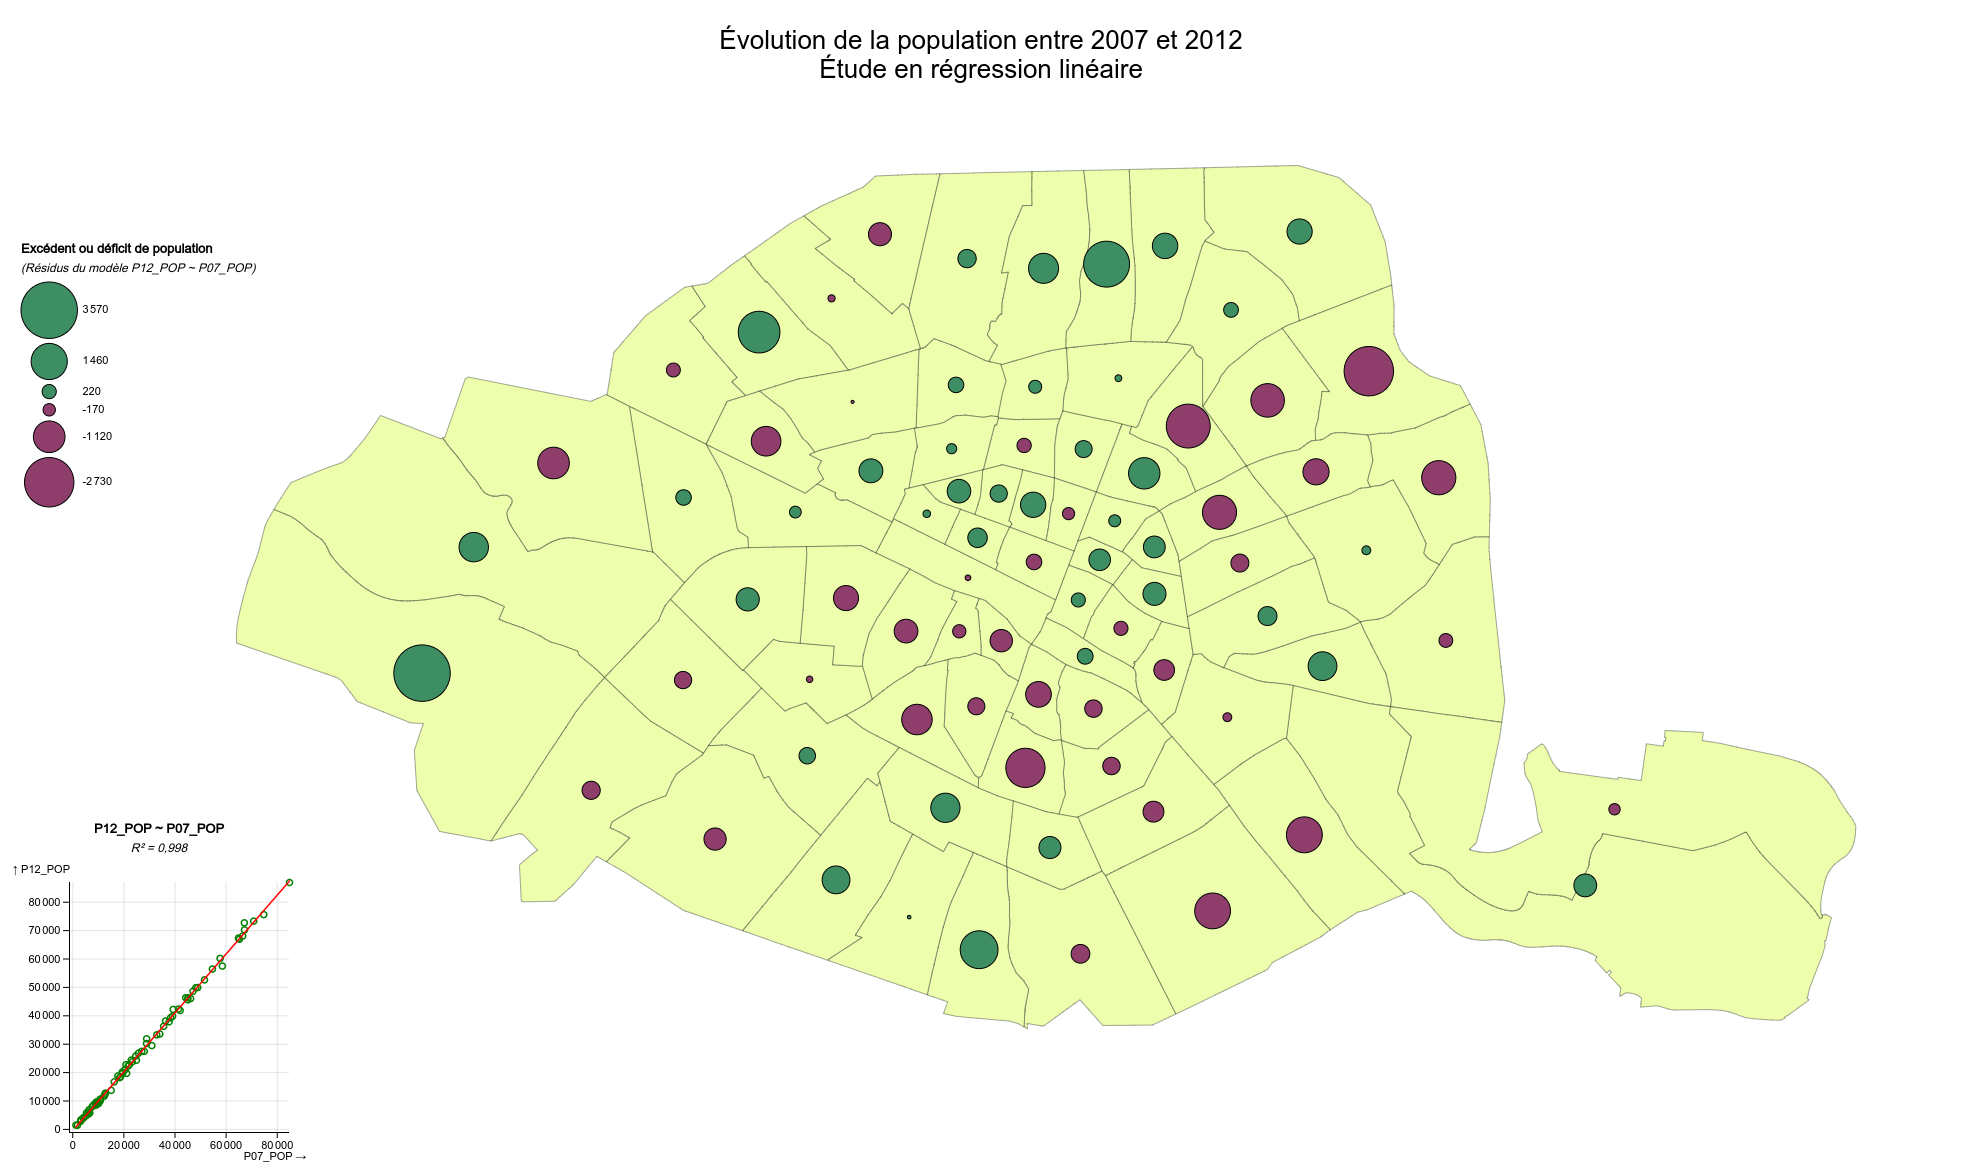
Once the relationship between the two variables has been established, it is possible to visualize this relationship in map form, in two different ways:
- either by mapping the regression residuals, i.e. the differences between the observed values and the values predicted by the model, via a map of proportional symbols,
- or by mapping the standardized residuals, i.e. the differences between the observed values and the values predicted by the model, divided by the standard deviation of the residuals, via a choropleth map.
Example
 Example of linear regression with representation of residuals (proportional symbols map)