
Trivariate choropleth
Trivariate choropleth maps are used to represent three variables that form a ternary composition (variables whose values, expressed as proportions, add up to 100%, or 1, for each spatial unit).
This type of representation relies on a fundamental geometric property: any ternary composition can be represented in an equilateral triangle, where each vertex corresponds to a pure variable (100%), and the position of each point inside the triangle reflects the relative proportions of the three components.
The triangle, or ternary diagram, is indeed the natural representation of compositional data, as it allows simultaneous visualization of the three dimensions while respecting the totality constraint (p1 + p2 + p3 = 100%). In this triangle, each point is defined by its barycentric coordinates: its position is determined by the proportions of the three variables, and it is this position that determines the color assigned to the corresponding spatial unit on the map.
This type of representation is particularly suitable for visualizing distribution structures, such as the distribution of economic activity sectors (primary, secondary, tertiary), land use composition (agricultural, urban, forest), or market shares of three dominant players (or three political parties).
This property allows highlighting composition profiles and imbalances between the three dimensions, sometimes offering a synthetic view of the spatial dynamics at work.
Help with reading the legend
To help with reading the ternary diagram, the following scheme can be used. To read the values of each variable for the unique point represented, simply follow the red bars that extend from the point towards each edge (i.e., towards each graduation axis). The value for each variable is then read on the corresponding axis.
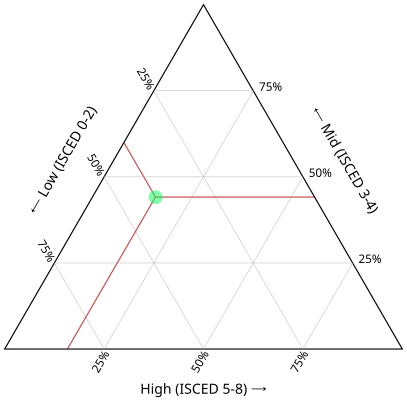 Help with reading the legend of a trivariate choropleth map
It can be seen here that the values are approximately 40% for variable 1 (ISCED 0-2), 45% for variable 2 (ISCED 3-4), and 15% for variable 3 (ISCED 5-8).
Using the rotation of the values displayed on the axes (available as an option) makes it easier to read the values for each variable, by displaying them in the reading direction of the corresponding variable.
Settings for controlling colors
In the "discrete" and "continuous" coloring modes, the colors are controlled by a set of parameters that enables adjusting the hue, saturation, and brightness of the colors assigned to each of the three components. It is therefore not possible to directly choose the colors for the three components, but rather to define a coloring scheme that will be applied to triangle. This ensures consistency in the data representation (same chroma and same brightness) and avoids arbitrary color choices that could mislead the interpretation of the results.
As such, the settings values used to control colors are as follows:
- Hue: Defines the hue of the first component (p1 - left corner). The hues of the other two components are automatically set to +120° (for p2 - top corner) and +240° (for p3 - right corner) on the color wheel, forming a triadic scheme.
- Chroma: Controls the maximum saturation/intensity of the colors at the corners of the triangle. The higher this value, the more vivid and distinct the colors.
- Lightness: Determines the overall brightness of the palette. Affects all colors in the triangle.
- Contrast: Controls the difference in brightness and saturation between the center (balanced mix) and the corners (pure components). Higher contrast makes the corners more distinct from the center.
- Spread: Controls the extent of the color gradient around the center. A higher value concentrates color differentiation near the center.
Example
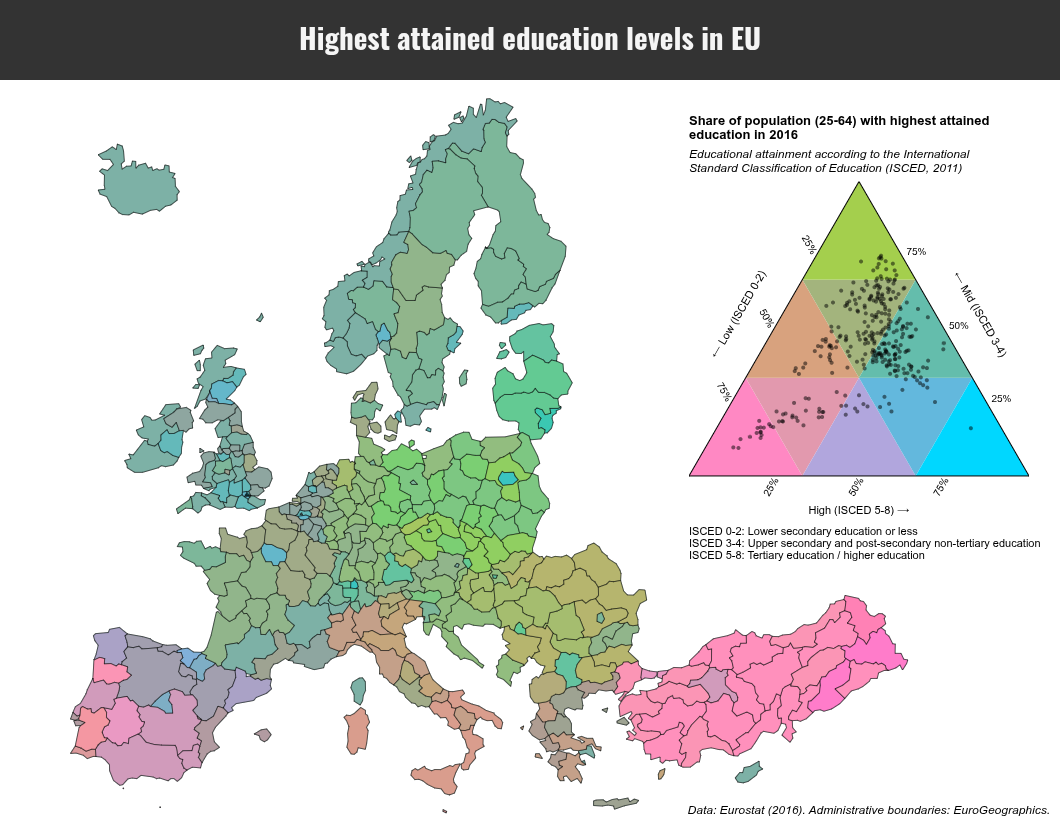 Example of a trivariate choropleth map (highest level of education - coloring in 9 classes)
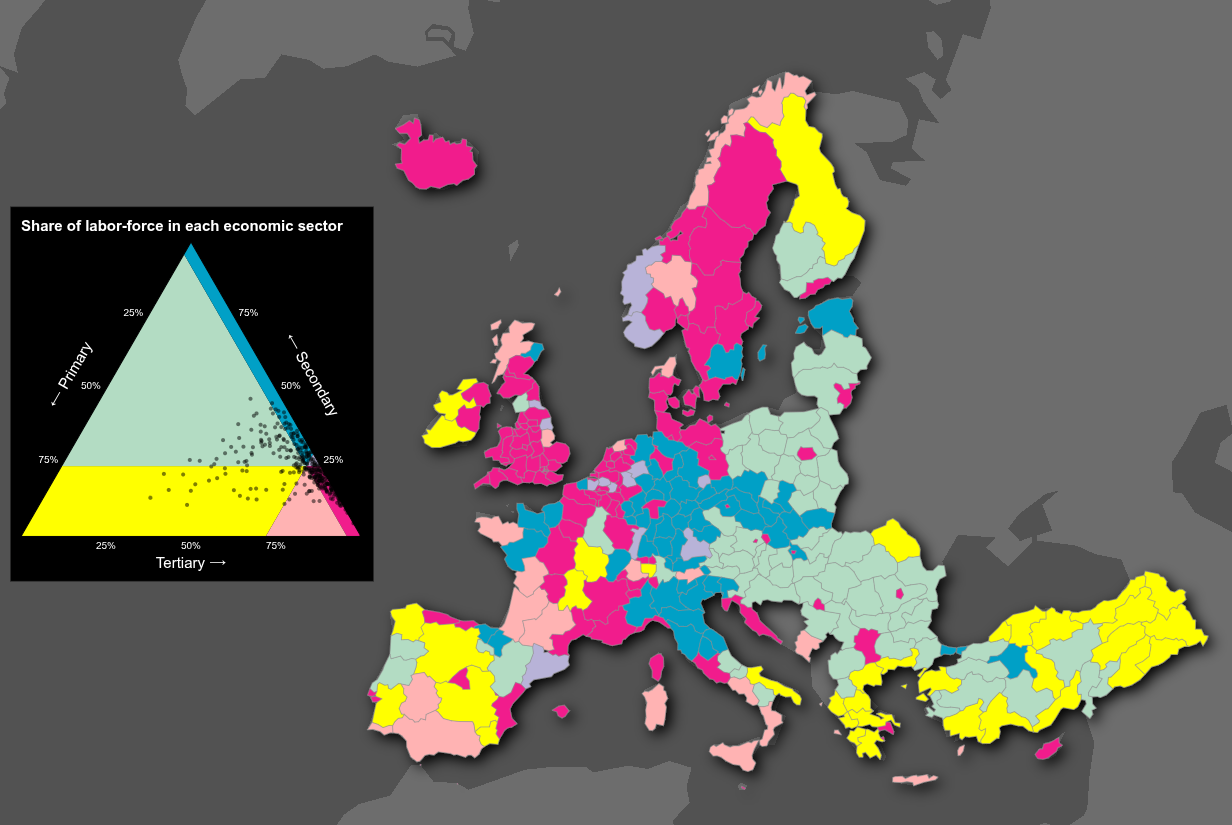 Example of a trivariate choropleth map (economic activity sectors - coloring by sextant - mean centering)
Limits and alternatives
Trivariate choropleth maps, while powerful for visualizing compositions, have limitations that should be considered.
First, their visual complexity can make reading difficult, especially for an audience unfamiliar with ternary diagrams. The resulting colors, although logically constructed from barycentric coordinates, are not always intuitive. It is therefore essential to systematically accompany the map with a detailed legend and, if possible, explanatory text to guide interpretation.
Finally, this type of representation assumes that the three variables form a coherent composition (sum = 100%). If this condition is not met, or if the variables have no logical connection, the map can generate false interpretations. In such cases, it may be preferable to use other methods (side-by-side comparison of choropleth maps, small multiples, etc.).